Downstream class switching leads to IgE antibody production by B lymphocytes lacking IgM switch regions
- PMID: 20133637
- PMCID: PMC2840363
- DOI: 10.1073/pnas.0915072107
Downstream class switching leads to IgE antibody production by B lymphocytes lacking IgM switch regions
Erratum in
- Proc Natl Acad Sci U S A. 2013 Apr 2;110(14):5731
Abstract
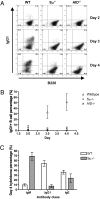
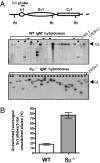
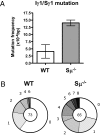
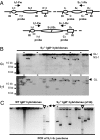
Ig heavy chain (IgH) class-switch recombination (CSR) replaces the IgH C mu constant region exons with one of several sets of downstream IgH constant region exons (e.g., C gamma, C epsilon, or C alpha), which affects switching from IgM to another IgH class (e.g., IgG, IgE, or IgA). Activation-induced cytidine deaminase (AID) initiates CSR by promoting DNA double-strand breaks (DSBs) within switch (S) regions flanking the donor C mu (S mu) and a downstream acceptor C(H) (e.g., S gamma, S epsilon, S alpha) that are then joined to complete CSR. DSBs generated in S mu frequently are joined within S mu to form internal switch region deletions (ISD). AID-induced ISD and mutations have been considered rare in downstream S regions, suggesting that AID targeting to these S regions requires its prior recruitment to S mu. We have now assayed for CSR and ISD in B cells lacking S mu (S mu(-/-) B cells). In S mu(-/-) B cells activated for CSR to IgG1 and IgE, CSR to IgG1 was greatly reduced; but, surprisingly, CSR to IgE occurred at nearly normal levels. Moreover, normal B cells had substantial S gamma1 ISD and increased mutations in and near S gamma1, and levels of both were greatly increased in S mu(-/-) B cells. Finally, S mu(-/-) B cells underwent downstream CSR between S gamma1 and S epsilon on alleles that lacked S mu CSR to these sequences. Our findings show that AID targets downstream S regions independently of CSR with Smu and implicate an alternative pathway for IgE class switching that involves generation and joining of DSBs within two different downstream S regions before S mu joining.
Conflict of interest statement
The authors declare no conflict of interest.
Figures


Similar articles
-
Alternative end-joining catalyzes robust IgH locus deletions and translocations in the combined absence of ligase 4 and Ku70.Proc Natl Acad Sci U S A. 2010 Feb 16;107(7):3034-9. doi: 10.1073/pnas.0915067107. Epub 2010 Jan 25. Proc Natl Acad Sci U S A. 2010. PMID: 20133803 Free PMC article.
-
Internal IgH class switch region deletions are position-independent and enhanced by AID expression.Proc Natl Acad Sci U S A. 2002 Jul 23;99(15):9984-9. doi: 10.1073/pnas.152333499. Epub 2002 Jul 11. Proc Natl Acad Sci U S A. 2002. PMID: 12114543 Free PMC article.
-
Orientation-specific joining of AID-initiated DNA breaks promotes antibody class switching.Nature. 2015 Sep 3;525(7567):134-139. doi: 10.1038/nature14970. Epub 2015 Aug 26. Nature. 2015. PMID: 26308889 Free PMC article.
-
Evolution of the immunoglobulin heavy chain class switch recombination mechanism.Adv Immunol. 2007;94:157-214. doi: 10.1016/S0065-2776(06)94006-1. Adv Immunol. 2007. PMID: 17560275 Review.
-
Regulation of immunoglobulin class-switch recombination: choreography of noncoding transcription, targeted DNA deamination, and long-range DNA repair.Adv Immunol. 2014;122:1-57. doi: 10.1016/B978-0-12-800267-4.00001-8. Adv Immunol. 2014. PMID: 24507154 Free PMC article. Review.
Cited by
-
Switch Tandem Repeats Influence the Choice of the Alternative End-Joining Pathway in Immunoglobulin Class Switch Recombination.Front Immunol. 2022 May 16;13:870933. doi: 10.3389/fimmu.2022.870933. eCollection 2022. Front Immunol. 2022. PMID: 35651614 Free PMC article.
-
Sense transcription through the S region is essential for immunoglobulin class switch recombination.EMBO J. 2011 Apr 20;30(8):1608-20. doi: 10.1038/emboj.2011.56. Epub 2011 Mar 4. EMBO J. 2011. PMID: 21378751 Free PMC article.
-
Polyclonal hyper-IgE mouse model reveals mechanistic insights into antibody class switch recombination.Proc Natl Acad Sci U S A. 2013 Sep 24;110(39):15770-5. doi: 10.1073/pnas.1221661110. Epub 2013 Sep 9. Proc Natl Acad Sci U S A. 2013. PMID: 24019479 Free PMC article.
-
AIDing Chromatin and Transcription-Coupled Orchestration of Immunoglobulin Class-Switch Recombination.Front Immunol. 2014 Mar 28;5:120. doi: 10.3389/fimmu.2014.00120. eCollection 2014. Front Immunol. 2014. PMID: 24734031 Free PMC article. Review.
-
Contribution of Dysregulated B-Cells and IgE Antibody Responses to Multiple Sclerosis.Front Immunol. 2022 Jun 16;13:900117. doi: 10.3389/fimmu.2022.900117. eCollection 2022. Front Immunol. 2022. PMID: 35784370 Free PMC article. Review.
References
-
- Dudley DD, Chaudhuri J, Bassing CH, Alt FW. Mechanism and control of V(D)J recombination versus class switch recombination: Similarities and differences. Adv Immunol. 2005;86:43–112. - PubMed
-
- Honjo T, et al. Rearrangements of immunoglobulin genes during differentiation and evolution. Immunol Rev. 1981;59:33–67. - PubMed
-
- Honjo T. Immunoglobulin genes. Annu Rev Immunol. 1983;1:499–528. - PubMed
-
- Muramatsu M, et al. Class switch recombination and hypermutation require activation-induced cytidine deaminase (AID), a potential RNA editing enzyme. Cell. 2000;102:553–563. - PubMed
-
- Revy P, et al. Activation-induced cytidine deaminase (AID) deficiency causes the autosomal recessive form of the Hyper-IgM syndrome (HIGM2) Cell. 2000;102:565–575. - PubMed
Publication types
MeSH terms
Substances
Grants and funding
LinkOut - more resources
Full Text Sources
Molecular Biology Databases
Research Materials
Miscellaneous

