

Mass spectrometry imaging of mating Tetrahymena show that changes in cell morphology regulate lipid domain formation
- PMID: 20133641
- PMCID: PMC2840282
- DOI: 10.1073/pnas.0908101107
Mass spectrometry imaging of mating Tetrahymena show that changes in cell morphology regulate lipid domain formation
Abstract
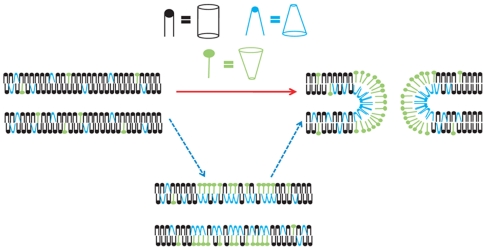
Mass spectrometry imaging has been used here to suggest that changes in membrane structure drive lipid domain formation in mating single-cell organisms. Chemical studies of lipid bilayers in both living and model systems have revealed that chemical composition is coupled to localized membrane structure. However, it is not clear if the lipids that compose the membrane actively modify membrane structure or if structural changes cause heterogeneity in the surface chemistry of the lipid bilayer. We report that time-of-flight secondary ion mass spectrometry images of mating Tetrahymena thermophila acquired at various stages during mating demonstrate that lipid domain formation, identified as a decrease in the lamellar lipid phosphatidylcholine, follows rather than precedes structural changes in the membrane. Domains are formed in response to structural changes that occur during cell-to-cell conjugation. This observation has wide implications in all membrane processes.
Conflict of interest statement
The authors declare no conflict of interest.
Figures

Similar articles
-
Mass spectrometric imaging of highly curved membranes during Tetrahymena mating.Science. 2004 Jul 2;305(5680):71-3. doi: 10.1126/science.1099791. Science. 2004. PMID: 15232100 Free PMC article.
-
Surface view of the lateral organization of lipids and proteins in lung surfactant model systems-a ToF-SIMS approach.Biochim Biophys Acta. 2010 Apr;1798(4):730-40. doi: 10.1016/j.bbamem.2009.10.011. Epub 2009 Oct 29. Biochim Biophys Acta. 2010. PMID: 19879237 Review.
-
Non-bilayer lipids and biological fusion intermediates.Chem Phys Lipids. 1996 Jul 15;81(2):203-13. doi: 10.1016/0009-3084(96)02583-2. Chem Phys Lipids. 1996. PMID: 8810049 Review.
-
Restoration of cellular integrity following "ballistic" pronuclear exchange during Tetrahymena conjugation.Dev Biol. 2018 Dec 1;444(1):33-40. doi: 10.1016/j.ydbio.2018.09.019. Epub 2018 Sep 27. Dev Biol. 2018. PMID: 30268714
-
Structure and functional properties of diacylglycerols in membranes.Prog Lipid Res. 1999 Jan;38(1):1-48. doi: 10.1016/s0163-7827(98)00021-6. Prog Lipid Res. 1999. PMID: 10396601 Review.
Cited by
-
Improving the Molecular Ion Signal Intensity for In Situ Liquid SIMS Analysis.J Am Soc Mass Spectrom. 2016 Dec;27(12):2006-2013. doi: 10.1007/s13361-016-1478-x. Epub 2016 Sep 6. J Am Soc Mass Spectrom. 2016. PMID: 27600576
-
Reconstituting ring-rafts in bud-mimicking topography of model membranes.Nat Commun. 2014 Jul 24;5:4507. doi: 10.1038/ncomms5507. Nat Commun. 2014. PMID: 25058275 Free PMC article.
-
Single-cell mass spectrometry with multi-solvent extraction identifies metabolic differences between left and right blastomeres in the 8-cell frog (Xenopus) embryo.Analyst. 2016 Jun 21;141(12):3648-56. doi: 10.1039/c6an00200e. Epub 2016 Mar 23. Analyst. 2016. PMID: 27004603 Free PMC article.
-
Mass Spectrometric Imaging of Plasma Membrane Lipid Alteration Correlated with Amperometrically Measured Activity-Dependent Plasticity in Exocytosis.Int J Mol Sci. 2020 Dec 14;21(24):9519. doi: 10.3390/ijms21249519. Int J Mol Sci. 2020. PMID: 33327662 Free PMC article.
-
Advancements in ToF-SIMS imaging for life sciences.Front Chem. 2023 Aug 24;11:1237408. doi: 10.3389/fchem.2023.1237408. eCollection 2023. Front Chem. 2023. PMID: 37693171 Free PMC article. Review.
References
-
- Blumenthal R, Clague MJ, Durell SR, Epand RM. Membrane fusion. Chem Rev. 2003;103(1):53–69. - PubMed
-
- Yang L, Huang HW. Observation of a membrane fusion intermediate structure. Science. 2002;297(5588):1877–1879. - PubMed
-
- Simons K, Ikonen E. Functional rafts in cell membranes. Nature. 1997;387(6633):569–572. - PubMed
Publication types
MeSH terms
Substances
Grants and funding
LinkOut - more resources
Full Text Sources
Molecular Biology Databases
