. 2010 Feb 16;107(7):2878-83.
doi: 10.1073/pnas.0906101107. Epub 2010 Feb 1.

Crystal structure of the bifunctional proline utilization A flavoenzyme from Bradyrhizobium japonicum

Affiliations

Crystal structure of the bifunctional proline utilization A flavoenzyme from Bradyrhizobium japonicum

Dhiraj Srivastava et al. Proc Natl Acad Sci U S A. .

Abstract

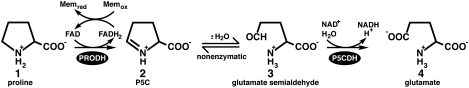
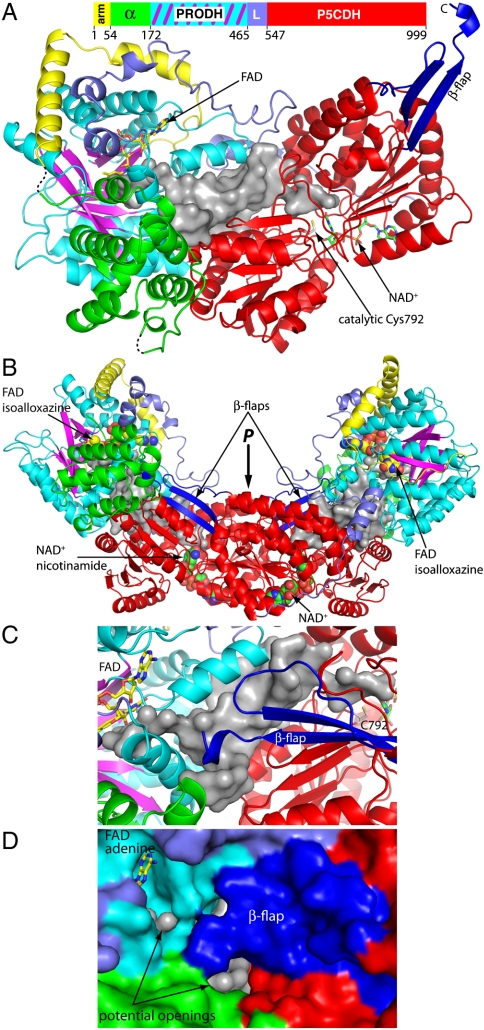
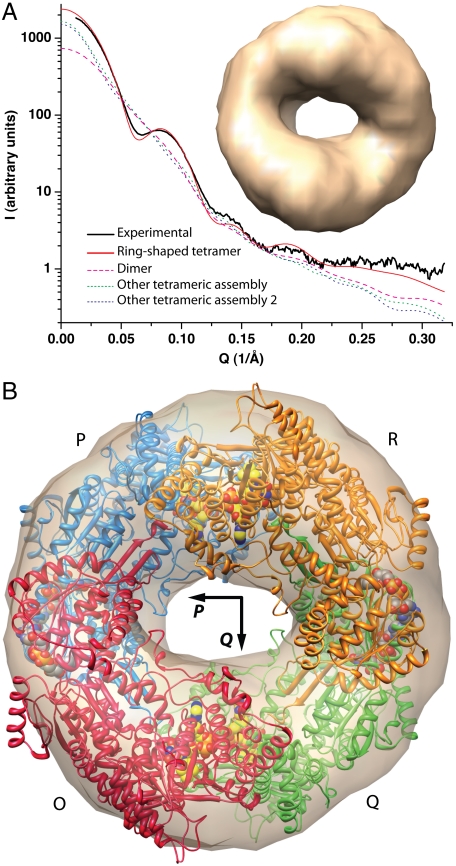
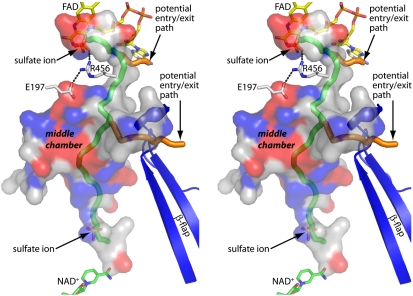
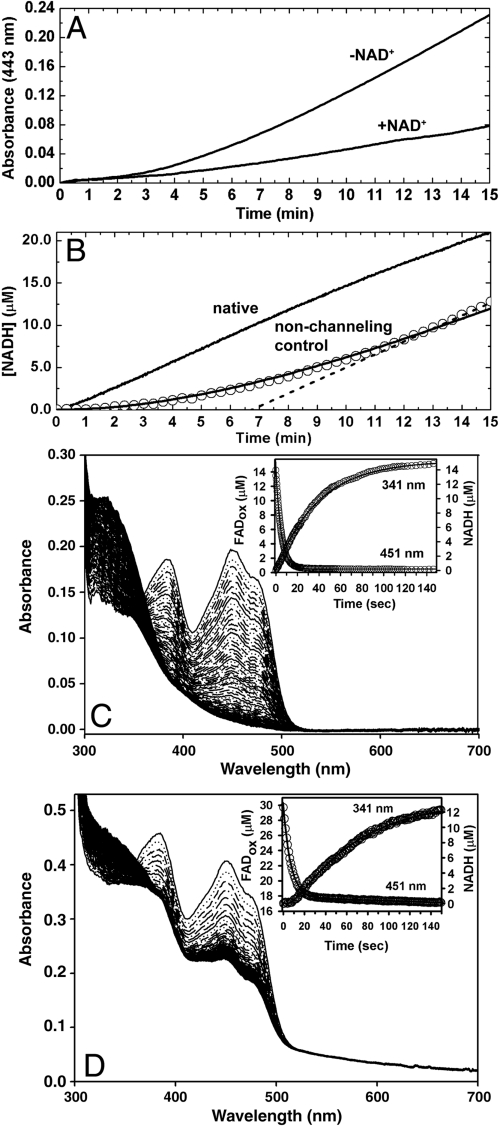
The bifunctional proline catabolic flavoenzyme, proline utilization A (PutA), catalyzes the oxidation of proline to glutamate via the sequential activities of FAD-dependent proline dehydrogenase (PRODH) and NAD(+)-dependent Delta(1)-pyrroline-5-carboxylate dehydrogenase (P5CDH) domains. Although structures for some of the domains of PutA are known, a structure for the full-length protein has not previously been solved. Here we report the 2.1 A resolution crystal structure of PutA from Bradyrhizobium japonicum, along with data from small-angle x-ray scattering, analytical ultracentrifugation, and steady-state and rapid-reaction kinetics. PutA forms a ring-shaped tetramer in solution having a diameter of 150 A. Within each protomer, the PRODH and P5CDH active sites face each other at a distance of 41 A and are connected by a large, irregularly shaped cavity. Kinetics measurements show that glutamate production occurs without a lag phase, suggesting that the intermediate, Delta(1)-pyrroline-5-carboxylate, is preferably transferred to the P5CDH domain rather than released into the bulk medium. The structural and kinetic data imply that the cavity serves both as a microscopic vessel for the hydrolysis of Delta(1)-pyrroline-5-carboxylate to glutamate semialdehyde and a protected conduit for the transport of glutamate semialdehyde to the P5CDH active site.


Conflict of interest statement

The authors declare no conflict of interest.

Figures

Fig. 1.
Fig. 1.
The reactions catalyzed by PRODH and P5CDH.
Fig. 2.
Fig. 2.
Structure of BjPutA. (A) Ribbon drawing of the protomer. The domains are color coded as follows: yellow, N-terminal arm; green α-helix bundle domain; cyan/magenta, PRODH domain; slate, linker; and red, P5CDH domain. FAD and NAD+ are drawn as sticks in yellow and green, respectively. The β-flap is colored blue. The silver surface represents the internal cavity that connects the two active sites. (B) The dimer of the asymmetric unit, colored as in A. FAD and NAD+ are drawn as spheres. (C) Close-up view of the dimer showing the region near the β-flap. The coloring scheme of A is used. (D) Surface representation of the β-flap region, shown with the same orientation and coloring scheme as in C.
Fig. 3.
Fig. 3.
SAXS analysis and tetrameric structure of BjPutA. (A) Experimental and simulated scattering profiles. The solid black curve represents a typical experimental scattering curve for BjPutA. The solid red curve represents the profile calculated from the ring-shaped tetramer shown in panel B. The dashed magenta curve was calculated from the dimer of the asymmetric unit. The two dotted curves were calculated from other tetrameric assemblies that are not shaped like a ring. The inset shows an ab initio shape restoration calculated from the experimental SAXS data using GASBOR. (B) Superposition of the SAXS reconstruction and the crystallographic tetramer. The four chains are labeled O (red), P (blue), Q (green), and R (orange). FAD and NAD+ are shown in yellow and gray spheres, respectively.
Fig. 4.
Fig. 4.
Stereographic view of the cavity. The cavity is represented as a semitransparent surface and is colored to indicate the locations of positively (blue) and negatively (red) charged residues lining the cavity. The tubes represent pathways identified by the program MOLE. The green tube guides the eye from the PRODH active site (Top) to the P5CDH active site (Bottom). The orange tubes represent possible pathways leading to the bulk medium.
Fig. 5.
Fig. 5.
Kinetic data. (A) P5C trapping experiments performed in the presence and absence of NAD+. (B) NADH formation by native BjPutA (upper solid curve) and a nonchanneling control consisting of an equimolar mixture of monofunctional variants R456M and C792A (circles). The solid curve overlaying the data for the nonchanneling control was calculated from Eq. S2 of SI Text. The dashed line represents the extrapolation used to estimate the transient time for the nonchanneling control. For clarity, only a subset of the experimental data points for the nonchanneling control is displayed. (C) Rapid-reaction kinetic data for native BjPutA acquired under single turnover conditions. PutA (14.26 µM), NAD+ (0.1 mM), and proline (40 mM) were rapidly mixed (concentrations after mixing) and monitored by stopped-flow multiwavelength absorption. The spectra shown were recorded at 0.0025–250 sec after mixing. Inset: Plots of FAD reduction and NADH formation monitored at 451 nm and 341 nm, respectively. The observed rate constants for reduction of FAD and NAD+ are 0.2 s-1 and 0.025 s-1, respectively, estimated from single exponential fits of the data as described in SI Text. (D) Rapid-reaction kinetic data for the nonchanneling control acquired under single turnover conditions. BjPutA variants C792A and R456M (14.9 µM each), NAD+ (0.1 mM), and proline (40 mM) were rapidly mixed (concentrations after mixing) and monitored by stopped-flow multiwavelength absorption. The spectra shown were recorded at 0.0025–300 sec after mixing. Inset: Plots of FAD reduction and NADH formation monitored at 451 nm and 341 nm, respectively. The observed rate constants for reduction of FAD and NAD+ are 0.144 s-1 and 0.016 s-1, respectively, estimated from double exponential fits of the data as described in SI Text.

Similar articles

Cited by

References

    1. Phang JM, Donald SP, Pandhare J, Liu Y. The metabolism of proline, a stress substrate, modulates carcinogenic pathways. Amino Acids. 2008;35(4):681–690. - PubMed
    1. Phang JM, Hu CA, Valle D. Disorders of proline and hydroxyproline metabolism. In: Scriver CR, Beaudet AL, Sly WS, Valle D, editors. Metabolic and Molecular Basis of Inherited Disease. New York: McGraw Hill; 2001. pp. 1821–1838.
    1. Willis A, Bender HU, Steel G, Valle D. PRODH variants and risk for schizophrenia. Amino Acids. 2008;35(4):673–679. - PubMed
    1. Nagata K, et al. L-Serine, D- and L-proline and alanine as respiratory substrates of Helicobacter pylori: correlation between in vitro and in vivo amino acid levels. Microbiology+ 2003;149(Pt 8):2023–2030. - PubMed
    1. Bringaud F, Riviere L, Coustou V. Energy metabolism of trypanosomatids: Adaptation to available carbon sources. Mol Biochem Parasitol. 2006;149(1):1–9. - PubMed

Publication types