. 2010 Feb 23;107(8):3793-8.
doi: 10.1073/pnas.1000159107. Epub 2010 Feb 4.

Representational gain in cortical area underlies increase of memory strength

Affiliations

Representational gain in cortical area underlies increase of memory strength

Kasia M Bieszczad et al. Proc Natl Acad Sci U S A. .

Erratum in

  • Proc Natl Acad Sci U S A. 2013 Mar 26;110(13):5269

Abstract

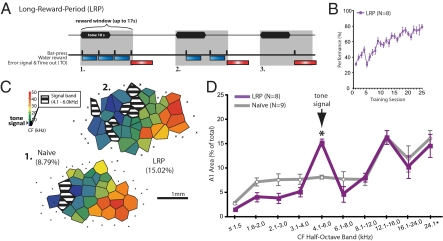
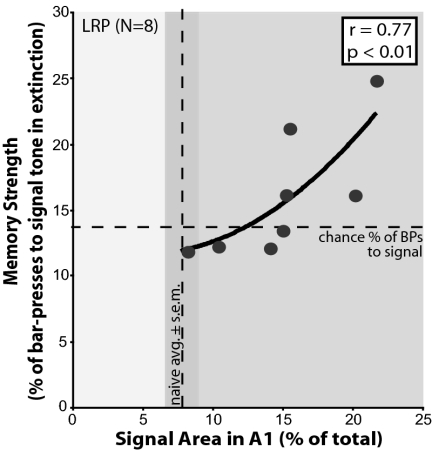
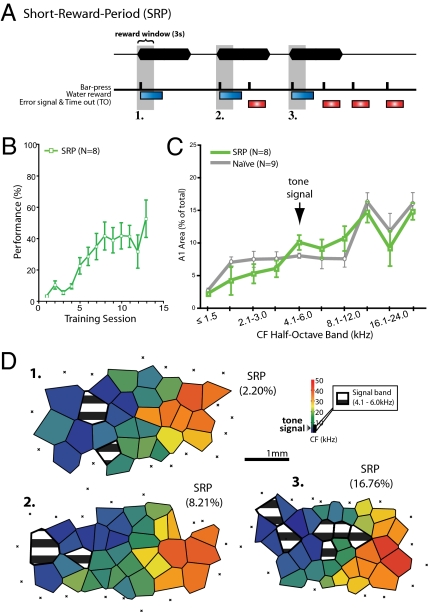
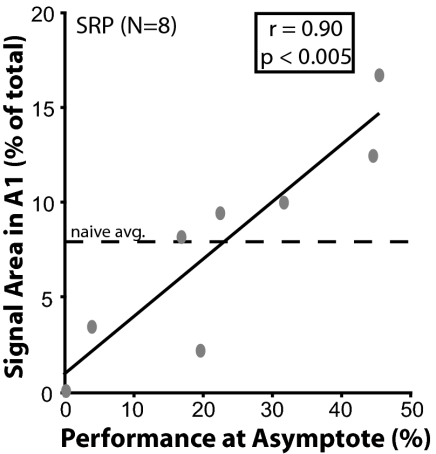
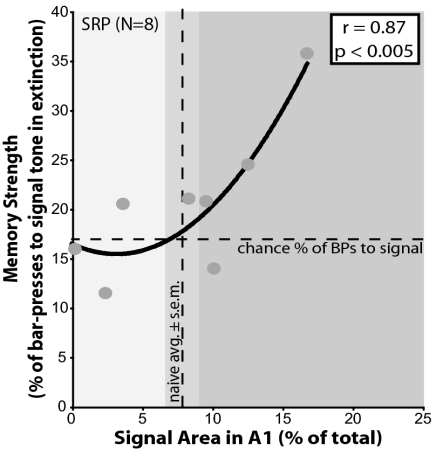
Neuronal plasticity that develops in the cortex during learning is assumed to represent memory content, but the functions of such plasticity are actually unknown. The shift in spectral tuning in primary auditory cortex (A1) to the frequency of a tone signal is a compelling candidate for a substrate of memory because it has all of the cardinal attributes of associative memory: associativity, specificity, rapid induction, consolidation, and long-term retention. Tuning shifts increase the representational area of the signal in A1, as an increasing function of performance level, suggesting that area encodes the magnitude of acquired stimulus significance. The present study addresses the question of the specific function of learning-induced associative representational plasticity. We tested the hypothesis that specific increases in A1 representational area for an auditory signal serve the mnemonic function of enhancing memory strength for that signal. Rats were trained to bar-press for reward contingent on the presence of a signal tone (5.0 kHz), and assessed for memory strength during extinction. The amount of representational area gain for the signal frequency band was significantly positively correlated with resistance to extinction to the signal frequency in two studies that spanned the range of task difficulty. These findings indicate that specific gain in cortical representational area underlies the strength of the behaviorally-relevant contents of memory. Thus, mnemonic functions of cortical plasticity are determinable.


Conflict of interest statement

The authors declare no conflict of interest.

Figures

Fig. 1.
Fig. 1.
Bar-pressing for water rewards to tones in the long-reward-window (LRP) group. Behavior and representational area in A1. (A) The LRP protocol required animals to BP for rewards during a 17-s reward window that began at tone onset. Up to two water rewards (blue bars) could be delivered during the tone with the possibility of one more reward in the remaining 17-s window (examples 1 and 2) for a maximum of three rewards per trial. If no BPs were made during the tone, then BPs after the tone were not rewarded (example 3). BPs during silent intertrial-intervals were signaled as errors with a flashing light during a time-out period (red bars) 50% of the time (i.e., 3–7 s extension of time until the next trial). (B) LRP group performance improved across sessions (asymptote = 76.2 ± 2.3%; days 1–17, n = 8; day 18–19, n = 7; day 20–21, n = 6; day 22–25, n = 5). (C) Exemplar maps of characteristic frequency (CF) from naïve (1) and an LRP subjects (2) show a gain of signal area in the trained animal. Striped polygons show the area of representation of the signal-frequency within a half-octave band and values show the percent of total area for the signal band. (D) The relative amount (percent) of representational area occupied by half octave bands across the tonotopic map of A1 in the LRP and naïve groups. Note that the only significant gain in area was at the signal-frequency band in the LRP group (5.0 kHz ±0.25 octaves; 4.1–6.0 kHz) (asterisk).
Fig. 2.
Fig. 2.
Memory strength correlates with the amount of signal-specific area gains in A1 in the LRP group. The x axis shows the amount of relative area in A1 for the signal-frequency (half-octave band). The y axis shows the strength of memory for the signal tone (5.0 kHz) determined by its resistance to extinction relative to five other nonsignal frequencies (2.8, 7.5, 12.9, 15.8, and 21.7 kHz). LRP animals showed increases in area relative to the naïve group (vertical dashed line, s.e.m. marked by shaded area). The increase of memory strength was defined as the proportion of bar-pressing to the signal tone greater above chance (estimated as the percentage of responses to the signal tone if behavior were equal across all six test frequencies: [100%/(6 possible tone responses + 1 for possibility of no response) = 14.29%; see Methods] (horizontal dashed line). Increased memory strength for the signal tone is significantly positively correlated with the amount of area gain in A1 (best fit regression, curvilinear: r = 0.77, P < 0.01).
Fig. 3.
Fig. 3.
Bar-pressing for water rewards to tones in the SRP group. Behavior and representational area in A1. (A) The SRP protocol required animals to BP for rewards during a brief 3-s reward window that began at tone onset. Only one water reward could be delivered per trial. All BPs during the tone after 3 s and during ITI were signaled as errors with a flashing light during a time-out period. Example 1 shows an optimal pattern of behavior: the BP is limited to the 3-s reward window after tone onset. Example 2 shows a correct response followed by an erroneous BP later during the tone. Example 3 shows a correct BP followed by errors later during the tone and during the silent part of the ITI. (B) Group performance improved across sessions (asymptote = 42.6 ± 8.1%; days 1–11, n = 8; day 12, n = 3; day 13, n = 2). (C) Group CF distributions (half-octave bands) across A1 compared to a naïve group did not reveal a significant gain in area at any signal-frequency band. (D) Exemplar maps for three subjects (1–3) show variability in the amount of signal-band representation within the SRP group. Striped polygons show the area of representation of the signal-frequency. Percentages indicate the relative amount of A1 area occupied by the signal-frequency (±0.25 octaves). Examples show cases of smaller (#1, 2.20%), approximately equal (#2, 8.21%), or larger (#3, 16.76%) signal-band areas than naïve (7.67 ± 1.62%; see Fig. 1D).
Fig. 4.
Fig. 4.
Relationship between performance and the representational area for the signal frequency of 5.0 kHz (±0.25 octaves). Vertical dashed line indicates the mean representational area in the naïve group (7.67%). The level of asymptotic performance in the SRP group is significantly positively correlated with the amount of representational area gain (r = 0.90, P < 0.005).
Fig. 5.
Fig. 5.
Memory strength is correlated with the amount of signal-specific area in A1 in the SRP group. The x axis shows the amount of relative area in A1 for the signal-frequency (±0.25 octaves). Vertical dashed line indicates the mean area of representation in the naïve group (±SEM marked by shaded area). The y axis shows the strength of memory for the signal tone (5.0 kHz) determined by its resistance to extinction relative to four other nonsignal frequencies (1.1, 2.4, 10.6, and 22.4 kHz). Increase of memory strength was defined as the proportion of bar-pressing to the signal tone greater than chance. Chance level was estimated as the percentage of responses to the signal tone if behavior were equal across all five test frequencies ([100%/(5 possible tone responses + 1 for possibility of no response) = 16.67%]; see Methods) (horizontal dashed line). Memory strength is significantly positively correlated with the amount of signal-representational area in A1 (best fit regression, curvilinear: r = 0.87, P < 0.005).

Similar articles

Cited by

References

    1. Bakin JS, Weinberger NM. Classical conditioning induces CS-specific receptive field plasticity in the auditory cortex of the guinea pig. Brain Res. 1990;536:271–286. - PubMed
    1. Bakin JS, South DA, Weinberger NM. Induction of receptive field plasticity in the auditory cortex of the guinea pig during instrumental avoidance conditioning. Behav Neurosci. 1996;110:905–913. - PubMed
    1. Weinberger NM. Associative representational plasticity in the auditory cortex: a synthesis of two disciplines. Learn Mem. 2007;14:1–16. - PMC - PubMed
    1. Diamond DM, Weinberger NM. Classical conditioning rapidly induces specific changes in frequency receptive fields of single neurons in secondary and ventral ectosylvian auditory cortical fields. Brain Res. 1986;372:357–360. - PubMed
    1. Edeline J-M, Pham P, Weinberger NM. Rapid development of learning-induced receptive field plasticity in the auditory cortex. Behav Neurosci. 1993;107:539–551. - PubMed

Publication types