

Evidence for a recent increase in forest growth
- PMID: 20133710
- PMCID: PMC2840472
- DOI: 10.1073/pnas.0912376107
Evidence for a recent increase in forest growth
Abstract
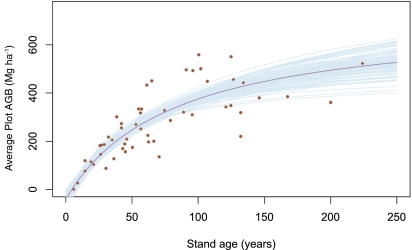
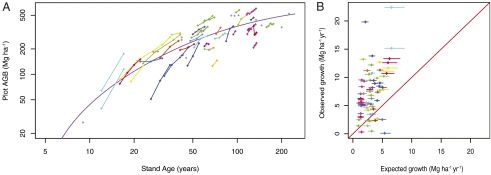
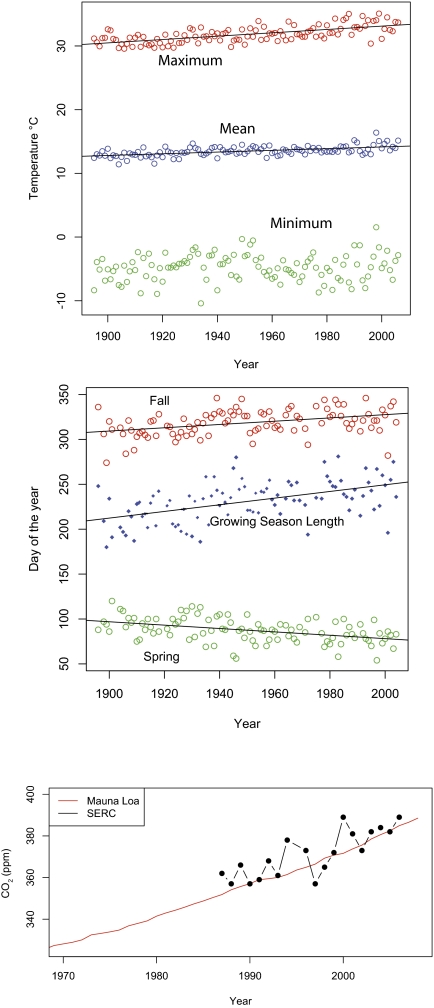
Forests and their soils contain the majority of the earth's terrestrial carbon stocks. Changes in patterns of tree growth can have a huge impact on atmospheric cycles, biogeochemical cycles, climate change, and biodiversity. Recent studies have shown increases in biomass across many forest types. This increase has been attributed to climate change. However, without knowing the disturbance history of a forest, growth could also be caused by normal recovery from unknown disturbances. Using a unique dataset of tree biomass collected over the past 22 years from 55 temperate forest plots with known land-use histories and stand ages ranging from 5 to 250 years, we found that recent biomass accumulation greatly exceeded the expected growth caused by natural recovery. We have also collected over 100 years of local weather measurements and 17 years of on-site atmospheric CO(2) measurements that show consistent increases in line with globally observed climate-change patterns. Combined, these observations show that changes in temperature and CO(2) that have been observed worldwide can fundamentally alter the rate of critical natural processes, which is predicted by biogeochemical models. Identifying this rate change is important to research on the current state of carbon stocks and the fluxes that influence how carbon moves between storage and the atmosphere. These results signal a pressing need to better understand the changes in growth rates in forest systems, which influence current and future states of the atmosphere and biosphere.
Conflict of interest statement
The authors declare no conflict of interest.
Figures
Comment in
-
Evidence for a recent increase in forest growth is questionable.Proc Natl Acad Sci U S A. 2010 May 25;107(21):E86-7; author reply E88-9. doi: 10.1073/pnas.1002725107. Epub 2010 May 3. Proc Natl Acad Sci U S A. 2010. PMID: 20439700 Free PMC article. No abstract available.
References
-
- Barford CC, et al. Factors controlling long-and short-term sequestration of atmospheric CO2 in a mid-latitude forest. Science. 2001;294:1688–1691. - PubMed
-
- Schimel DS, et al. Recent patterns and mechanisms of carbon exchange by terrestrial ecosystems. Nature. 2001;414:169–172. - PubMed
-
- Wright SJ. Tropical forests in a changing environment. Trends Ecol Evol. 2005;20:553–560. - PubMed
-
- Solomon S, Qin D, Manning M, Chen Z, Marquis M, Averyt KB, Tignor M, Miller HL, editors. Climate Change 2007: The Physical Science Basis. Contribution of Working Group I to the Fourth Assessment Report of the Intergovernmental Panel on Climate Change. Cambridge University Press, Cambridge, United Kingdom and New York, NY, USA.
-
- Cao M, Woodward F. Dynamic responses of terrestrial ecosystem carbon cycling to global climate change. Nature. 1998;393:249–252.
Publication types
MeSH terms
Substances
LinkOut - more resources
Full Text Sources
Other Literature Sources
Miscellaneous
