

Attribution of climate forcing to economic sectors
- PMID: 20133724
- PMCID: PMC2816198
- DOI: 10.1073/pnas.0906548107
Attribution of climate forcing to economic sectors
Abstract
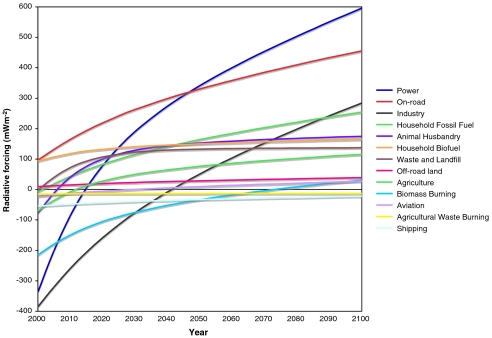
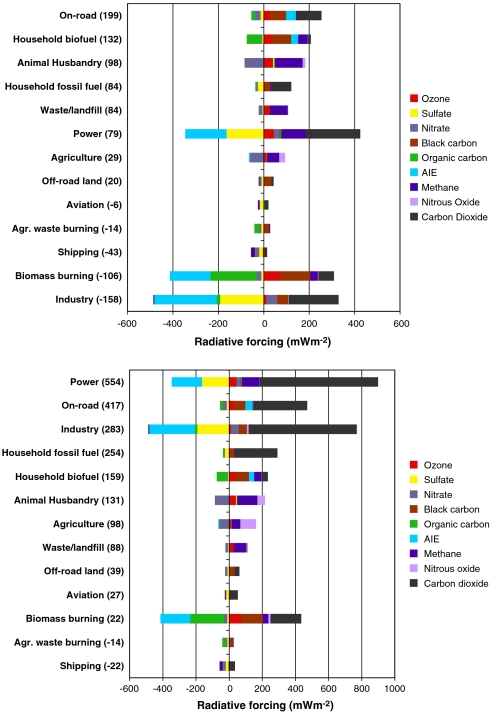
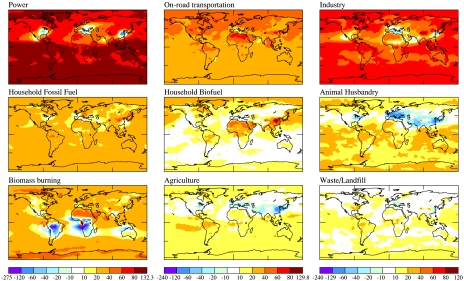
A much-cited bar chart provided by the Intergovernmental Panel on Climate Change displays the climate impact, as expressed by radiative forcing in watts per meter squared, of individual chemical species. The organization of the chart reflects the history of atmospheric chemistry, in which investigators typically focused on a single species of interest. However, changes in pollutant emissions and concentrations are a symptom, not a cause, of the primary driver of anthropogenic climate change: human activity. In this paper, we suggest organizing the bar chart according to drivers of change-that is, by economic sector. Climate impacts of tropospheric ozone, fine aerosols, aerosol-cloud interactions, methane, and long-lived greenhouse gases are considered. We quantify the future evolution of the total radiative forcing due to perpetual constant year 2000 emissions by sector, most relevant for the development of climate policy now, and focus on two specific time points, near-term at 2020 and long-term at 2100. Because sector profiles differ greatly, this approach fosters the development of smart climate policy and is useful to identify effective opportunities for rapid mitigation of anthropogenic radiative forcing.
Conflict of interest statement
The authors declare no conflict of interest.
Figures
References
-
- Levy H, II, Shindell DT, Gilliland A, Schwarzkopf MD, Horowitz LW. Climate Projections Based on Emissions Scenarios for Long-Lived and Short-Lived Radiatively Active Gases and Aerosols. 2008. pp. 1–120. U.S. Climate Change Science Program Synthesis and Assessment Product 3.2. Department of Commerce, NOAA National Climatic Data Center.
-
- Forster P, et al. In: Changes in Atmospheric Constituents and in Radiative Forcing, in Climate Change 2007: The Physical Science Basis, Contribution of Working Group I to the Fourth Assessment Report of the Intergovernmental Panel on Climate Change. Solomon S, et al., editors. New York: Cambridge Univ Press; 2007.
-
- Twomey SA. Aerosols, clouds, and radiation. Atmos Environ. 1991;25A:2435–2442.
-
- Albrecht B. Aerosols, cloud microphysics, and fractional cloudiness. Science. 1989;245:1227–1230. - PubMed
-
- Hansen J, Sato Mki, Ruedy R. Radiative forcing and climate response. J Geophys Res. 1997;102:6831–6864.
Publication types
MeSH terms
LinkOut - more resources
Full Text Sources
Medical
