

Competition between native topology and nonnative interactions in simple and complex folding kinetics of natural and designed proteins
- PMID: 20133730
- PMCID: PMC2840274
- DOI: 10.1073/pnas.0911844107
Competition between native topology and nonnative interactions in simple and complex folding kinetics of natural and designed proteins
Abstract
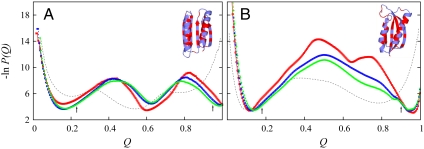
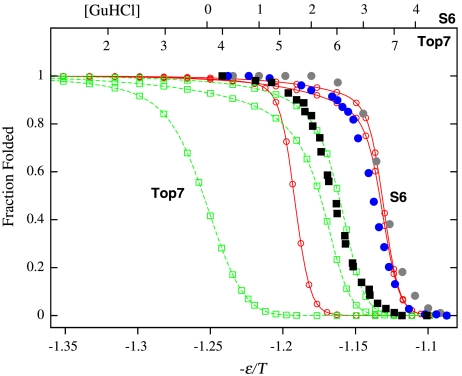
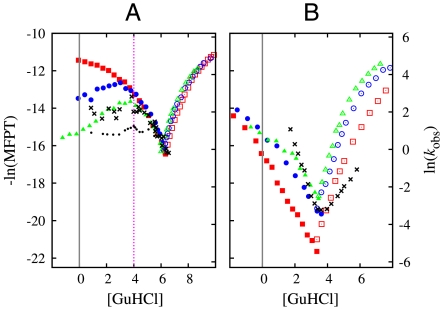
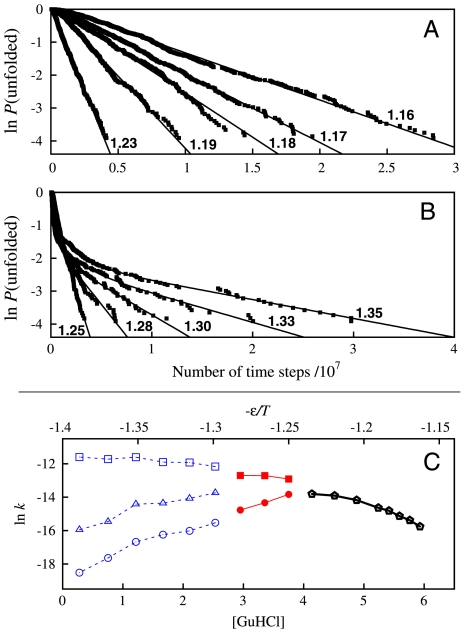
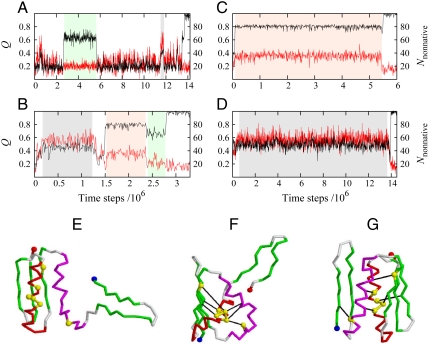
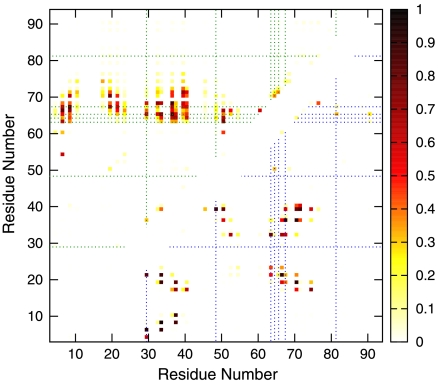
We compared folding properties of designed protein Top7 and natural protein S6 by using coarse-grained chain models with a mainly native-centric construct that accounted also for nonnative hydrophobic interactions and desolvation barriers. Top7 and S6 have similar secondary structure elements and are approximately equal in length and hydrophobic composition. Yet their experimental folding kinetics were drastically different. Consistent with experiment, our simulated folding chevron arm for Top7 exhibited a severe rollover, whereas that for S6 was essentially linear, and Top7 model kinetic relaxation was multiphasic under strongly folding conditions. The peculiar behavior of Top7 was associated with several classes of kinetic traps in our model. Significantly, the amino acid residues participating in nonnative interactions in trapped conformations in our Top7 model overlapped with those deduced experimentally. These affirmations suggest that the simple ingredients of native topology plus sequence-dependent nonnative interactions are sufficient to account for some key features of protein folding kinetics. Notably, when nonnative interactions were absent in the model, Top7 chevron rollover was not correctly predicted. In contrast, nonnative interactions had little effect on the quasi linearity of the model folding chevron arm for S6. This intriguing distinction indicates that folding cooperativity is governed by a subtle interplay between the sequence-dependent driving forces for native topology and the locations of favorable nonnative interactions entailed by the same sequence. Constructed with a capability to mimic this interplay, our simple modeling approach should be useful in general for assessing a designed sequence's potential to fold cooperatively.
Conflict of interest statement
The authors declare no conflict of interest.
Figures
Similar articles
-
Native topology of the designed protein Top7 is not conducive to cooperative folding.Biophys J. 2009 Feb;96(3):L25-7. doi: 10.1016/j.bpj.2008.11.004. Biophys J. 2009. PMID: 19186118 Free PMC article.
-
Designing cooperativity into the designed protein Top7.Proteins. 2014 Mar;82(3):364-74. doi: 10.1002/prot.24393. Epub 2013 Oct 17. Proteins. 2014. PMID: 23966061
-
Native contact density and nonnative hydrophobic effects in the folding of bacterial immunity proteins.PLoS Comput Biol. 2015 May 27;11(5):e1004260. doi: 10.1371/journal.pcbi.1004260. eCollection 2015 May. PLoS Comput Biol. 2015. PMID: 26016652 Free PMC article.
-
Cooperativity, local-nonlocal coupling, and nonnative interactions: principles of protein folding from coarse-grained models.Annu Rev Phys Chem. 2011;62:301-26. doi: 10.1146/annurev-physchem-032210-103405. Annu Rev Phys Chem. 2011. PMID: 21453060 Review.
-
Protein folding simulations: from coarse-grained model to all-atom model.IUBMB Life. 2009 Jun;61(6):627-43. doi: 10.1002/iub.223. IUBMB Life. 2009. PMID: 19472192 Review.
Cited by
-
Theoretical Insights into the Biophysics of Protein Bi-stability and Evolutionary Switches.PLoS Comput Biol. 2016 Jun 2;12(6):e1004960. doi: 10.1371/journal.pcbi.1004960. eCollection 2016 Jun. PLoS Comput Biol. 2016. PMID: 27253392 Free PMC article.
-
Energy landscape and multiroute folding of topologically complex proteins adenylate kinase and 2ouf-knot.Proc Natl Acad Sci U S A. 2012 Oct 30;109(44):17789-94. doi: 10.1073/pnas.1201807109. Epub 2012 Jul 2. Proc Natl Acad Sci U S A. 2012. PMID: 22753508 Free PMC article.
-
Domains of Pyrococcus furiosus L-asparaginase fold sequentially and assemble through strong intersubunit associative forces.Extremophiles. 2015 May;19(3):681-91. doi: 10.1007/s00792-015-0748-z. Epub 2015 Apr 11. Extremophiles. 2015. PMID: 25862541
-
Nonnative interactions in coupled folding and binding processes of intrinsically disordered proteins.PLoS One. 2010 Nov 4;5(11):e15375. doi: 10.1371/journal.pone.0015375. PLoS One. 2010. PMID: 21079758 Free PMC article.
-
Learning To Fold Proteins Using Energy Landscape Theory.Isr J Chem. 2014 Aug;54(8-9):1311-1337. doi: 10.1002/ijch.201300145. Isr J Chem. 2014. PMID: 25308991 Free PMC article.
References
-
- Bryngelson JD, Onuchic JN, Socci ND, Wolynes PG. Funnels, pathways, and the energy landscape of protein folding: A synthesis. Proteins. 1995;21:167–195. - PubMed
-
- Thirumalai D, Woodson SA. Kinetics of folding of proteins and RNA. Acc Chem Res. 1996;29:433–439.
-
- Chan HS, Dill KA. Protein folding in the landscape perspective: Chevron plots and non-Arrhenius kinetics. Proteins. 1998;30:2–33. - PubMed
Publication types
MeSH terms
Substances
Grants and funding
LinkOut - more resources
Full Text Sources
