

Role of microRNA-23b in flow-regulation of Rb phosphorylation and endothelial cell growth
- PMID: 20133741
- PMCID: PMC2840325
- DOI: 10.1073/pnas.0914825107
Role of microRNA-23b in flow-regulation of Rb phosphorylation and endothelial cell growth
Abstract
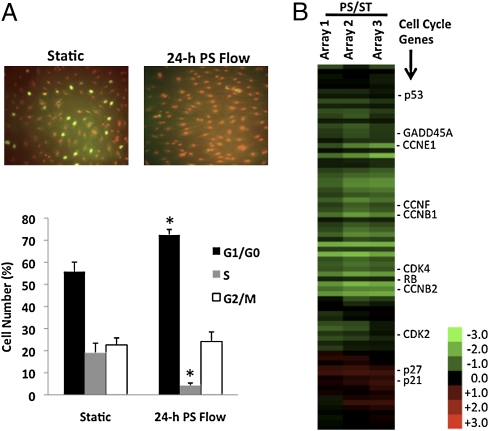
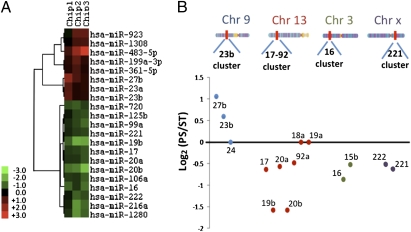
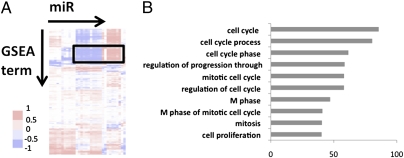
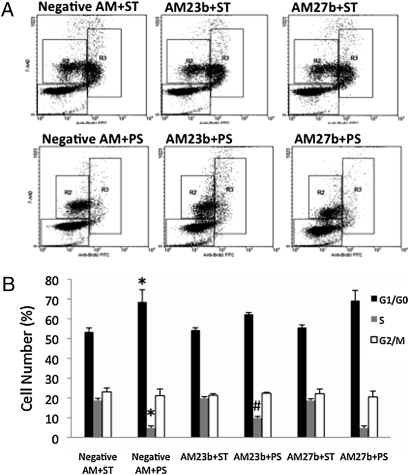
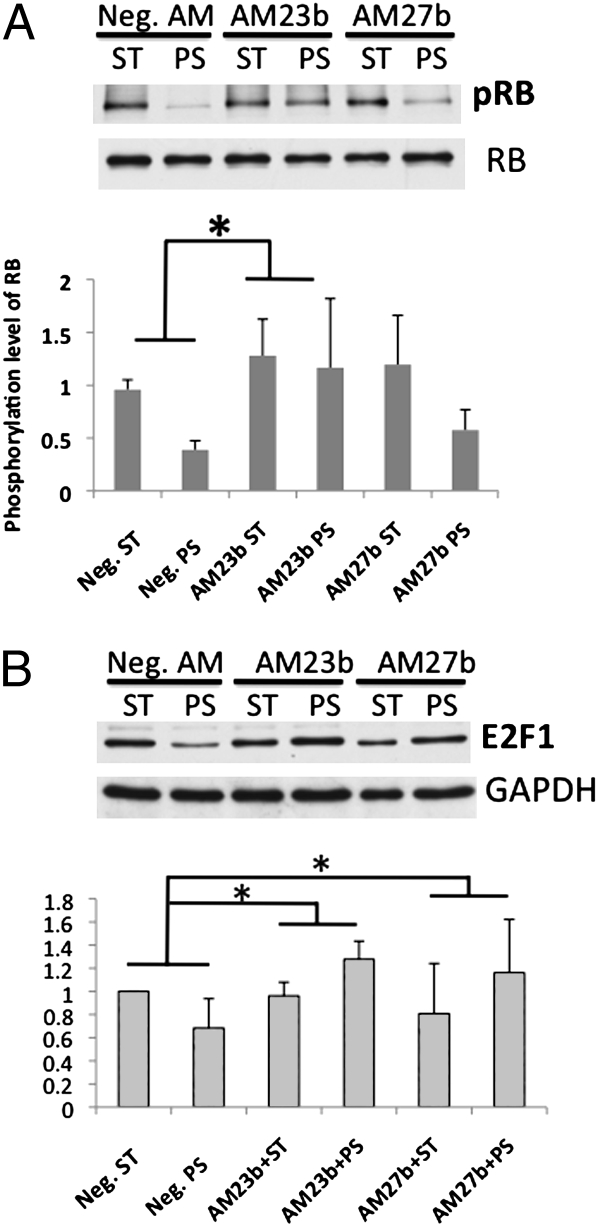
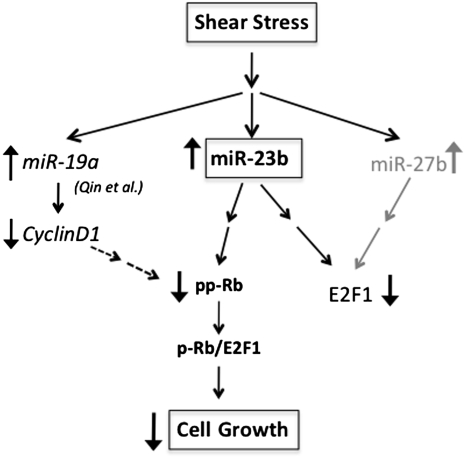
MicroRNAs (miRs) can regulate many cellular functions, but their roles in regulating responses of vascular endothelial cells (ECs) to mechanical stimuli remain unexplored. We hypothesize that the physiological responses of ECs are regulated by not only mRNA and protein signaling networks, but also expression of the corresponding miRs. EC growth arrest induced by pulsatile shear (PS) flow is an important feature for flow regulation of ECs. miR profiling showed that 21 miRs are differentially expressed (8 up- and 13 downregulated) in response to 24-h PS as compared to static condition (ST). The mRNA expression profile indicates EC growth arrest under 24-h PS. Analysis of differentially expressed miRs yielded 68 predicted mRNA targets that overlapped with results of microarray mRNA profiling. Functional analysis of miR profile indicates that the cell cycle network is highly regulated. The upregulation of miR-23b and miR-27b was found to correlate with the PS-induced EC growth arrest. Inhibition of miR-23b using antagomir-23b oligonucleotide (AM23b) reversed the PS-induced E2F1 reduction and retinoblastoma (Rb) hypophosphorylation and attenuated the PS-induced G1/G0 arrest. Antagomir AM27b regulated E2F1 expression, but did not affect Rb and growth arrest. Our findings indicate that PS suppresses EC proliferation through the regulation of miR-23b and provide insights into the role of miRs in mechanotransduction.
Conflict of interest statement
The authors declare no conflict of interest.
Figures
Similar articles
-
MicroRNA-23b regulates cyclin-dependent kinase-activating kinase complex through cyclin H repression to modulate endothelial transcription and growth under flow.Arterioscler Thromb Vasc Biol. 2014 Jul;34(7):1437-45. doi: 10.1161/ATVBAHA.114.303473. Epub 2014 May 22. Arterioscler Thromb Vasc Biol. 2014. PMID: 24855060 Free PMC article.
-
The feedback regulation of PI3K-miR-19a, and MAPK-miR-23b/27b in endothelial cells under shear stress.Molecules. 2012 Dec 20;18(1):1-13. doi: 10.3390/molecules18010001. Molecules. 2012. PMID: 23344184 Free PMC article.
-
Mechanosensitive microRNAs-role in endothelial responses to shear stress and redox state.Free Radic Biol Med. 2013 Sep;64:61-8. doi: 10.1016/j.freeradbiomed.2013.05.034. Epub 2013 May 30. Free Radic Biol Med. 2013. PMID: 23727269 Free PMC article. Review.
-
The microRNA -23b/-27b cluster suppresses the metastatic phenotype of castration-resistant prostate cancer cells.PLoS One. 2012;7(12):e52106. doi: 10.1371/journal.pone.0052106. Epub 2012 Dec 26. PLoS One. 2012. PMID: 23300597 Free PMC article.
-
Role of flow-sensitive microRNAs in endothelial dysfunction and atherosclerosis: mechanosensitive athero-miRs.Arterioscler Thromb Vasc Biol. 2014 Oct;34(10):2206-16. doi: 10.1161/ATVBAHA.114.303425. Epub 2014 Jul 10. Arterioscler Thromb Vasc Biol. 2014. PMID: 25012134 Free PMC article. Review.
Cited by
-
The role of miRNAs in the diagnosis of stable atherosclerosis of different arterial territories: A critical review.Front Cardiovasc Med. 2022 Nov 25;9:1040971. doi: 10.3389/fcvm.2022.1040971. eCollection 2022. Front Cardiovasc Med. 2022. PMID: 36505351 Free PMC article. Review.
-
Atherosclerosis and flow: roles of epigenetic modulation in vascular endothelium.J Biomed Sci. 2019 Aug 7;26(1):56. doi: 10.1186/s12929-019-0551-8. J Biomed Sci. 2019. PMID: 31387590 Free PMC article. Review.
-
MiR-145 mediates cell morphology-regulated mesenchymal stem cell differentiation to smooth muscle cells.Biomaterials. 2019 Jun;204:59-69. doi: 10.1016/j.biomaterials.2019.03.003. Epub 2019 Mar 8. Biomaterials. 2019. PMID: 30884320 Free PMC article.
-
Endothelial microRNAs and atherosclerosis.Curr Atheroscler Rep. 2013 Dec;15(12):372. doi: 10.1007/s11883-013-0372-2. Curr Atheroscler Rep. 2013. PMID: 24158362 Free PMC article. Review.
-
Shear stress-initiated signaling and its regulation of endothelial function.Arterioscler Thromb Vasc Biol. 2014 Oct;34(10):2191-8. doi: 10.1161/ATVBAHA.114.303422. Epub 2014 May 29. Arterioscler Thromb Vasc Biol. 2014. PMID: 24876354 Free PMC article. Review.
References
-
- Chien S. Mechanotransduction and endothelial cell homeostasis: The wisdom of the cell. Am J Physiol Heart Circ Physiol. 2007;292:H1209–H1224. - PubMed
-
- Chien S. Mechanical and chemical regulation of endothelial cell polarity. Circ Res. 2006;98:863–865. - PubMed
-
- Wang N, et al. Shear stress regulation of Krüppel-like factor 2 expression is flow pattern-specific. Biochem Biophys Res Commun. 2006;341:1244–1251. - PubMed
-
- Matharu NM, Rainger GE, Vohra R, Nash GB. Effects of disturbed flow on endothelial cell function: Pathogenic implications of modified leukocyte recruitment. Biorheology. 2006;43:31–44. - PubMed
Publication types
MeSH terms
Substances
Grants and funding
LinkOut - more resources
Full Text Sources
Other Literature Sources
