Universal distribution of protein evolution rates as a consequence of protein folding physics
- PMID: 20133769
- PMCID: PMC2840281
- DOI: 10.1073/pnas.0910445107
Universal distribution of protein evolution rates as a consequence of protein folding physics
Abstract
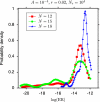
The hypothesis that folding robustness is the primary determinant of the evolution rate of proteins is explored using a coarse-grained off-lattice model. The simplicity of the model allows rapid computation of the folding probability of a sequence to any folded conformation. For each robust folder, the network of sequences that share its native structure is identified. The fitness of a sequence is postulated to be a simple function of the number of misfolded molecules that have to be produced to reach a characteristic protein abundance. After fixation probabilities of mutants are computed under a simple population dynamics model, a Markov chain on the fold network is constructed, and the fold-averaged evolution rate is computed. The distribution of the logarithm of the evolution rates across distinct networks exhibits a peak with a long tail on the low rate side and resembles the universal empirical distribution of the evolutionary rates more closely than either distribution resembles the log-normal distribution. The results suggest that the universal distribution of the evolutionary rates of protein-coding genes is a direct consequence of the basic physics of protein folding.
Conflict of interest statement
The authors declare no conflict of interest.
Figures


Similar articles
-
Predictability of evolutionary trajectories in fitness landscapes.PLoS Comput Biol. 2011 Dec;7(12):e1002302. doi: 10.1371/journal.pcbi.1002302. Epub 2011 Dec 15. PLoS Comput Biol. 2011. PMID: 22194675 Free PMC article.
-
Protein biophysics explains why highly abundant proteins evolve slowly.Cell Rep. 2012 Aug 30;2(2):249-56. doi: 10.1016/j.celrep.2012.06.022. Epub 2012 Aug 2. Cell Rep. 2012. PMID: 22938865 Free PMC article.
-
Recombinatoric exploration of novel folded structures: a heteropolymer-based model of protein evolutionary landscapes.Proc Natl Acad Sci U S A. 2002 Jan 22;99(2):809-14. doi: 10.1073/pnas.022240299. Proc Natl Acad Sci U S A. 2002. PMID: 11805332 Free PMC article.
-
Missense meanderings in sequence space: a biophysical view of protein evolution.Nat Rev Genet. 2005 Sep;6(9):678-87. doi: 10.1038/nrg1672. Nat Rev Genet. 2005. PMID: 16074985 Review.
-
Biophysical Models of Protein Evolution: Understanding the Patterns of Evolutionary Sequence Divergence.Annu Rev Biophys. 2017 May 22;46:85-103. doi: 10.1146/annurev-biophys-070816-033819. Epub 2017 Mar 15. Annu Rev Biophys. 2017. PMID: 28301766 Free PMC article. Review.
Cited by
-
Universal Constraints on Protein Evolution in the Long-Term Evolution Experiment with Escherichia coli.Genome Biol Evol. 2021 Jun 8;13(6):evab070. doi: 10.1093/gbe/evab070. Genome Biol Evol. 2021. PMID: 33856016 Free PMC article.
-
Replaying the tape of life: quantification of the predictability of evolution.Front Genet. 2012 Nov 26;3:246. doi: 10.3389/fgene.2012.00246. eCollection 2012. Front Genet. 2012. PMID: 23226153 Free PMC article.
-
Young proteins experience more variable selection pressures than old proteins.Genome Res. 2010 Nov;20(11):1574-81. doi: 10.1101/gr.109595.110. Epub 2010 Oct 4. Genome Res. 2010. PMID: 20921233 Free PMC article.
-
Catalysis of protein folding by chaperones accelerates evolutionary dynamics in adapting cell populations.PLoS Comput Biol. 2013;9(11):e1003269. doi: 10.1371/journal.pcbi.1003269. Epub 2013 Nov 7. PLoS Comput Biol. 2013. PMID: 24244114 Free PMC article.
-
Rapid Radiations and the Race to Redundancy: An Investigation of the Evolution of Australian Elapid Snake Venoms.Toxins (Basel). 2016 Oct 26;8(11):309. doi: 10.3390/toxins8110309. Toxins (Basel). 2016. PMID: 27792190 Free PMC article.
References
-
- Kimura M. The Neutral Theory of Molecular Evolution. Cambridge, UK: Cambridge Univ Press; 1983.
-
- Gillespie JH. The Causes of Molecular Evolution. Oxford: Oxford Univ Press; 1994.
-
- Zuckerkandl E. Evolutionary processes and evolutionary noise at the molecular level. I. Functional density in proteins. J Mol Evol. 1976;7:167–183. - PubMed
Publication types
MeSH terms
Substances
Grants and funding
LinkOut - more resources
Full Text Sources

