. 2010 Feb 9;107(6):2391-6.
doi: 10.1073/pnas.0911349107. Epub 2010 Jan 21.

Electron traps and their effect on the surface chemistry of TiO2(110)

Affiliations

Electron traps and their effect on the surface chemistry of TiO2(110)

Anthoula C Papageorgiou et al. Proc Natl Acad Sci U S A. .

Abstract

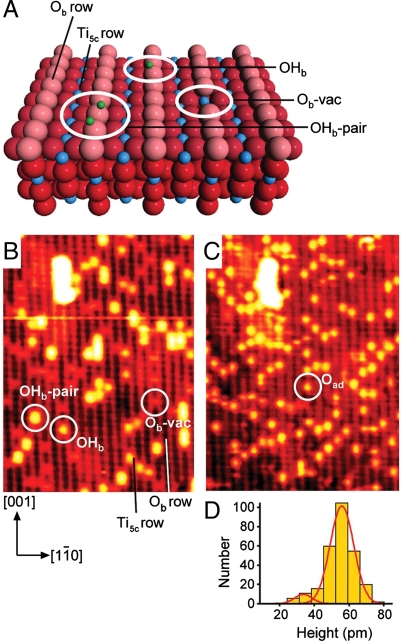
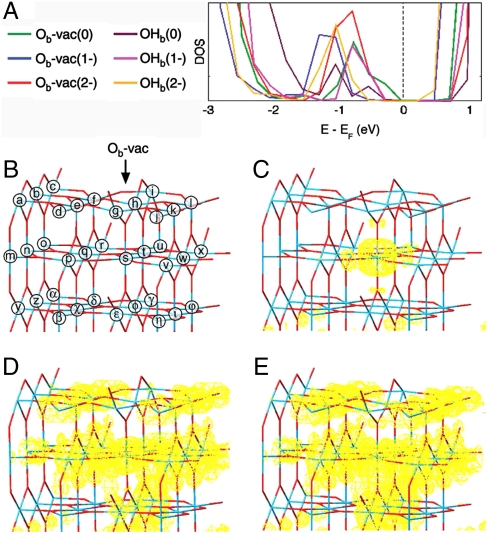
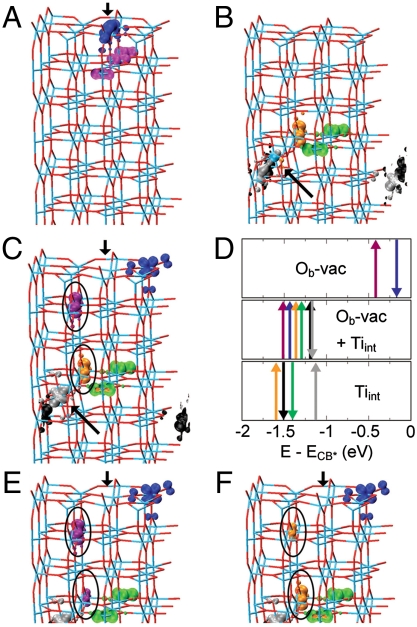
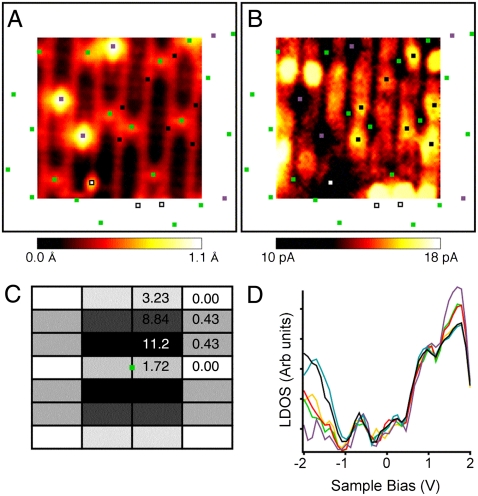
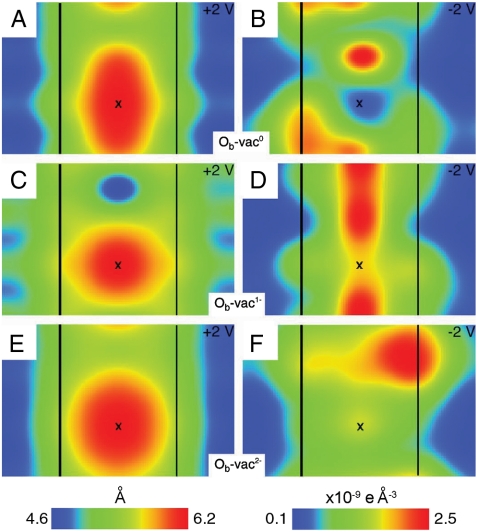
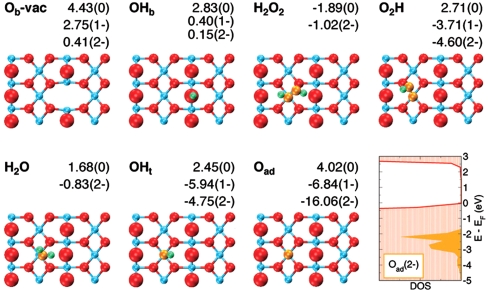
Oxygen vacancies on metal oxide surfaces have long been thought to play a key role in the surface chemistry. Such processes have been directly visualized in the case of the model photocatalyst surface TiO(2)(110) in reactions with water and molecular oxygen. These vacancies have been assumed to be neutral in calculations of the surface properties. However, by comparing experimental and simulated scanning tunneling microscopy images and spectra, we show that oxygen vacancies act as trapping centers and are negatively charged. We demonstrate that charging the defect significantly affects the reactivity by following the reaction of molecular oxygen with surface hydroxyl formed by water dissociation at the vacancies. Calculations with electronically charged hydroxyl favor a condensation reaction forming water and surface oxygen adatoms, in line with experimental observations. This contrasts with simulations using neutral hydroxyl where hydrogen peroxide is found to be the most stable product.


Conflict of interest statement

The authors declare no conflict of interest.

Figures

Fig. 1.
Fig. 1.
Reaction of O2 with TiO2(110). (A) Ball model of TiO2(110). Red and blue spheres denote O and Ti, respectively. The pink spheres are bridging O atoms, which lie in the [001] azimuth of the substrate. Parallel Ti rows that lie between the bridging-O rows are fivefold coordinated Ti atoms. Green spheres indicate H atoms (from OHb). (B) 130 × 170  2 STM image (V = 1.5 V, I = 0.25 nA) of an as-prepared TiO2(110) surface that contains Ob-vac and OHb. OHb forms from dissociation of water from the residual vacuum at Ob-vac. An Ob-vac, an OHb, and an OHb pair are indicated. (C) The surface in B after exposure to ∼90 L O2 at 300 K. One of the bright spots assigned to Oad is circled. B and C have been smoothed using Image SXM (12) v.1.75. (D) A histogram showing the height distribution of 276 bright spots found on the Ti5c rows fitted to two Gaussian curves. The data are taken from an unsmoothed, larger version of the image in C. The histogram indicates that the reaction products are almost entirely from one species.
Fig. 2.
Fig. 2.
Calculated electronic structure of Ob-vac and OHb. (A) The total density of states for the optimized layers in the presence of different amounts of extra electronic charge. (B) The TiO2(110) surface shown as a stick model where the blue intersections indicate Ti sites and the red intersections indicate O sites. The arrow points at the Ob-vac and each Ti atom is labeled. The global charge density of the BGS is shown in yellow (10-6 e  -3) for Ob-vac(0), Ob-vac(1 - ), and Ob-vac(2 - ) in C, D, and E, respectively.
Fig. 3.
Fig. 3.
Electronic charge density distribution (10-5 e  -3) for the BGS of the considered 8 trilayer systems. (A) Ob-vac, (B) one Tiint between the fourth and fifth trilayers, (C) Ob-vac modeled together with one Tiint between the fourth and fifth TiO2(110) trilayers (Ob-vac + Tiint). Blue intersections indicate Ti atoms and red intersections O atoms. Tiint is shown as a blue sphere. The positions of Ob-vac and Tiint are marked by the black arrows. Different colors have been used to distinguish between Tiint-donated (black, gray, green, orange), and surface Ob-vac induced (purple, blue) BGS. (D) Single-state energy level diagram with respect to the CB onset (E-E CB = 0) for the BGS in AC after vacuum level electrostatic alignment. Up and down arrows refer to the modeled spin of the specific state. The same BGS color labelling has been used for all the displayed AF panels. (E and F) For clarity, the hybridized BGS of Ob-vac + Tiint (orange and purple) circled in C, are redisplayed with the omission of the orange in E and purple in F BGS.
Fig. 4.
Fig. 4.
Experimental STM and STS data. (A) (44 )2 STM image recorded simultaneously with the STS. (B) (44 )2 CITS current map at -2 V. The squares in A and B show the positions of Ob-vac (green), OHb (purple), and some bright features associated with Ob-vac (black). One impurity is also present and marked with a white square. Using a larger-scale image, the positions of Ob-vac, OHb, and other impurities outside the area imaged in A and B are also indicated. A and B have been smoothed using Image SXM (12) v.1.75. (C) A correlation map between Ob-vac and bright features in B. The center of the map represents the position of an Ob-vac shown as a green square. The black rectangles represent unit cells centered on Ti5c atoms that surround Ob-vac. The results are averaged between the four quadrants with the numbers shown only in one quadrant. The results are expressed as percentages that add to 100% when the numbers in all four quadrants are summed. The darker the shading, the greater the probability of finding a bright feature at the separation indicated by the map. (D) STS spectra represented as LDOS plots by plotting (dI/dV) × (V/I) vs V (26). The LDOS plots are taken from the bright features associated with Ob-vac (black), Ob-vac (green), OHb (purple), Ti5c (yellow), and Ob (red). Each curve is averaged from 180 individual spectra taken from the CITS set shown in this work and another 180 individual spectra taken from an equivalent CITS set recorded in an identical area of the surface. The black squares in A and B indicate which bright features contribute to the curves for bright features associated with Ob-vac; none were counted when they were also diagonally adjacent to OHb or in close vicinity to impurities.
Fig. 5.
Fig. 5.
Modeled STM and CITS appearance for Ob-vac. Simulated STM images (+2 V, 10-7 e  -3) and current maps (-2 V, same height above the surface as from the corresponding left-side topography) are shown for Ob-vac(0) in A and B, for Ob-vac(1 - ) in C and D, and for Ob-vac(2 - ) in E and F. Ti5c rows are indicated by black lines, and an X marks the Ob-vac. STM simulations were performed with a tip-surface distance of ∼5 Å [the detailed procedure can be found in ref. (28)].
Fig. 6.
Fig. 6.
Plan view of surface species together with their grand-canonical formation free energies (T = 300 K, P O2 = 1.3 × 10-8 mbar, P H2O = 1 × 10-11 mbar). Ti is shown blue, lattice O red, O from adsorbates orange, and H green. Bridging oxygen (Ob) atoms are shown larger to highlight them. The energies are in eV and the brackets after the energies indicate the electronic charge of the surface species. Geometries are optimized (3 × 2 supercell) for the neutral state. The total density of states for the optimized layers (filled red) of Oad(2 - )/TiO2(110) is displayed together with the Oad(2 - )-projected density of states (PDOS, filled orange) in the bottom-right panel.

References

    1. Bikondoa O, et al. Direct visualization of defect-mediated dissociation of water on TiO2(110) Nat Mater. 2006;5:189–192.
    1. Wendt S, et al. Oxygen vacancies on TiO2(110) and their interaction with H2O and O2: A combined high-resolution STM and DFT study. Surf Sci. 2005;598:226–245.
    1. Henderson MA, Epling WS, Peden CHF, Perkins CL. Insights into photoexcited electron scavenging processes on TiO2 obtained from studies of the reaction of O2 with OH groups adsorbed at electronic defects on TiO2(110) J Phys Chem B. 2003;107:534–545.
    1. Zhang Z, et al. Water as a catalyst: Imaging reactions of O2 with partially and fully hydroxylated TiO2(110) surfaces. J Phys Chem C. 2009;113:1908–1916.
    1. Tilocca A, Di Valentin C, Selloni A. O2 interaction and reactivity on a model hydroxylated rutile(110) surface. J Phys Chem B. 2005;109:20963–20967. - PubMed

Publication types

LinkOut - more resources