. 2010 Feb 9;107(6):2497-502.
doi: 10.1073/pnas.0907240107. Epub 2010 Jan 21.

Synergistic antitumor effects of combined cathepsin B and cathepsin Z deficiencies on breast cancer progression and metastasis in mice

Affiliations

Synergistic antitumor effects of combined cathepsin B and cathepsin Z deficiencies on breast cancer progression and metastasis in mice

Lisa Sevenich et al. Proc Natl Acad Sci U S A. .

Abstract

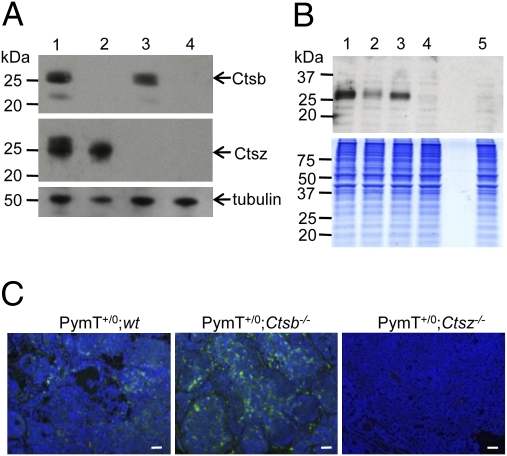
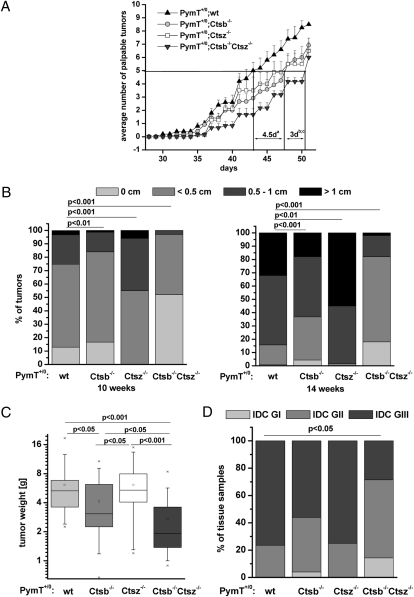
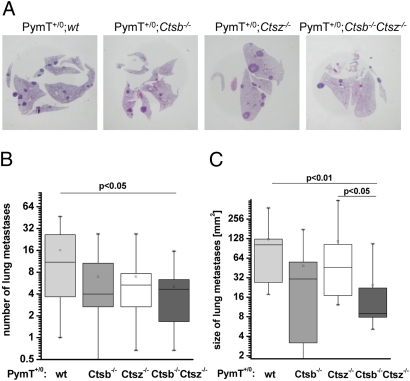
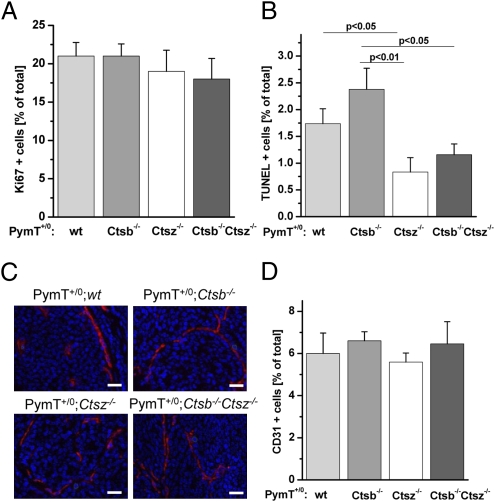
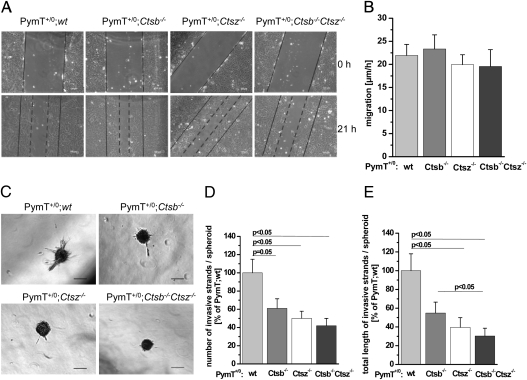
The lysosomal cysteine proteases cathepsin B (Ctsb) and cathepsin Z (Ctsz, also called cathepsin X/P) have been implicated in cancer pathogenesis. Compensation of Ctsb by Ctsz in Ctsb (-/-) mice has been suggested. To further define the functional interplay of these proteases in the context of cancer, we generated Ctsz null mice, crossed them with Ctsb-deficient mice harboring a transgene for the mammary duct-specific expression of polyoma middle T oncogene (PymT), and analyzed the effects of single and combined Ctsb and Ctsz deficiencies on breast cancer progression. Single Ctsb deficiency resulted in delayed detection of first tumors and reduced tumor burden, whereas Ctsz-deficient mice had only a prolonged tumor-free period. However, only a trend toward reduced metastatic burden without statistical significance was detected in both single mutants. Strikingly, combined loss of Ctsb and Ctsz led to additive effects, resulting in significant and prominent delay of early and advanced tumor development, improved histopathologic tumor grading, as well as a 70% reduction in the number of lung metastases and an 80% reduction in the size of these metastases. We conclude that the double deficiency of Ctsb and Ctsz exerts significant synergistic anticancer effects, whereas the single deficiencies demonstrate at least partial reciprocal compensation.


Conflict of interest statement

The authors declare no conflict of interest.

Figures

Fig. 1.
Fig. 1.
Expression pattern of Ctsb and Ctsz in PymT-induced mammary carcinomas. (A and B) Detection of Ctsb and Ctsz expression by Western blot analyses in primary tumor lysats (A) and cell surface labeling of active cysteine proteases by the biotinylated activity–based probe DCG-04 (B) on primary tumor cells of PymT+/0;wt [1], PymT+/0;Ctsb −/− [2], PymT+/0;Ctsz −/− [3], and PymT+/0;Ctsb −/− Ctsz −/− [4] mice. Unlabeled PymT+/0;wt control [5] was analyzed to detect endogenously biotinylated proteins. α-tubulin served and colloidal Coomassie blue–stained gel served as loading controls. (C) Detection of Ctsz (green staining) by immunofluorescence staining of PymT+/0;wt, PymT+/0;Ctsb −/−, and PymT+/0;Ctsz −/− tumor sections. (Scale bar: 50 μm.)
Fig. 2.
Fig. 2.
Tumor progression, tumor burden, and histopathology of mammary tumors. (A) Detection of first palpable tumors of PymT+/0;wt (n = 5), PymT+/0;Ctsb −/− (n = 12), PymT+/0;Ctsz −/− (n = 8), and PymT+/0;Ctsb −/− Ctsz −/− mice (n = 6) of all 10 mammary glands from day 28 to day 51. The time point at which each genotype developed 50% of tumors is indicated. Student´s t test was used for statistical analysis with (a) P <.01 for PymT+/0;wt compared with PymT+/0;Ctsb −/− and PymT+/0;Ctsz −/−, (b) P <.01 for PymT+/0;Ctsb−/−Ctsz −/− compared with PymT+/0;wt, and (c) P <.05 for PymT+/0;Ctsb −/− Ctsz −/− compared with PymT+/0;Ctsb −/− and PymT+/0;Ctsz −/−. (B) Estimation of the tumor size by palpation. Distribution of tumor size (0 cm, <0.5 cm, 0.5–1 cm, and >1 cm) per genotype is shown for the time points 10 and 14 weeks with PymT+/0;wt (n = 30), PymT+/0;Ctsb −/− (n = 30), PymT+/0;Ctsz −/− (n = 10), and PymT+/0;Ctsb −/− Ctsz −/− mice (n = 10). The χ2 test was used for statistical analysis. (C) The tumor weight of all 10 tumors per mouse was measured for PymT+/0;wt (n = 30), PymT+/0;Ctsb −/− (n = 40), PymT+/0;Ctsz −/− (n = 24), and PymT+/0;Ctsb −/− Ctsz −/− (n = 23). Data are presented as statistical boxplots; boxes include data between the 25th and 75th percentiles. Statistics wre analyzed using Student´s t test. (D) Histopathologic grading of H&E-stained tumor sections of 14-week-old PymT+/0;wt (n = 17), PymT+/0;Ctsb −/− (n = 25), PymT+/0;Ctsz −/− (n = 8), and PymT+/0;Ctsb −/− Ctsz −/− mice (n = 14). The χ2 test was used for statistical analysis.
Fig. 3.
Fig. 3.
Formation of lung metastases. (A) Representative images of H&E-stained lung sections. (B and C) Metastatic burden in lungs of 14-week-old PymT mice was assessed for number (B) and size (C) of metastases in three independent sectional planes per lung; n = 10 per genotype. Statistics were analyzed using Student´s t test.
Fig. 4.
Fig. 4.
Proliferation, cell death and mean vessel density in late-stage mammary carcinomas. (A and B) Quantification of Ki67+ cells (A) and TUNEL-positive cells (B) as percentage of total cells. The percentage of Ki67+ and TUNEL-positive cells was calculated from 60 high-power fields (HPF) per animal by computer-assisted data analyses using the histoquest software (TissueGnostics); n = 6 per genotype. (C) Representative images of immunofluoresence staining of the endothelial cell specific marker CD31 (red staining). (D) Quantification of CD31+ cells as percentage of total cells. The percentage of CD31+ cells was calculated from 300 HPF per animal; n = 5 per genotype. Data acquisition and analyses were performed with the microscope-based imaging platform ScanR (Olympus). Data are presented as mean ± SE. Student´s t test was used for statistical analysis. (Scale bar: 50 μm.)
Fig. 5.
Fig. 5.
Cell migration and invasive strand formation of primary PymT tumor spheroids. (A) Representative images of scratch closure in in vitro scratch assay. (B) Quantification of cell migration as the distance of scratch closure per hour within the first 21 h; n = 3–7 per genotype. (C) Representative images of primary PymT tumor cell spheroids in a collagen I matrix. (D and E) Formation of invasive strands of primary PymT tumor cell spheroids was assessed for number (D) and average strand length (E) per spheroid; n = 6–8 per genotype, with 40–50 spheroids analyzed. Data are presented as mean ± SE. Student´s t test was used for statistical analysis. (Scale bar: 100 μm.)

Similar articles

Cited by

References

    1. Gocheva V, et al. Distinct roles for cysteine cathepsin genes in multistage tumorigenesis. Genes Dev. 2006;20:543–556. - PMC - PubMed
    1. Werb Z, Vu TH, Rinkenberger JL, Coussens LM. Matrix-degrading proteases and angiogenesis during development and tumor formation. APMIS. 1999;107:11–18. - PubMed
    1. Du R, et al. HIF1alpha induces the recruitment of bone marrow–derived vascular modulatory cells to regulate tumor angiogenesis and invasion. Cancer Cell. 2008;13:206–220. - PMC - PubMed
    1. Van Damme J, Struyf S, Opdenakker G. Chemokine–protease interactions in cancer. Semin Cancer Biol. 2004;14:201–208. - PubMed
    1. Bachmeier BE, Nerlich AG, Lichtinghagen R, Sommerhoff CP. Matrix metalloproteinases (MMPs) in breast cancer cell lines of different tumorigenicity. Anticancer Res. 2001;21(6A):3821–3828. - PubMed

Publication types

MeSH terms

LinkOut - more resources