. 2010 Feb 2;107(5):1894-9.
doi: 10.1073/pnas.0914845107. Epub 2010 Jan 19.

The alternative splicing repressors hnRNP A1/A2 and PTB influence pyruvate kinase isoform expression and cell metabolism

Affiliations

The alternative splicing repressors hnRNP A1/A2 and PTB influence pyruvate kinase isoform expression and cell metabolism

Cynthia V Clower et al. Proc Natl Acad Sci U S A. .

Abstract

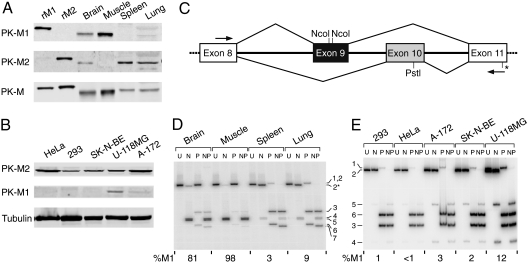
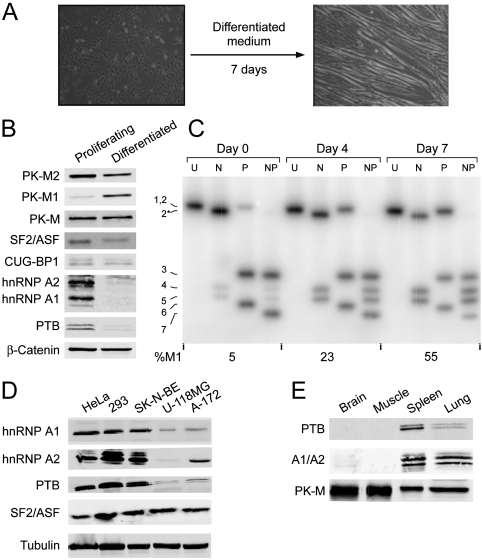
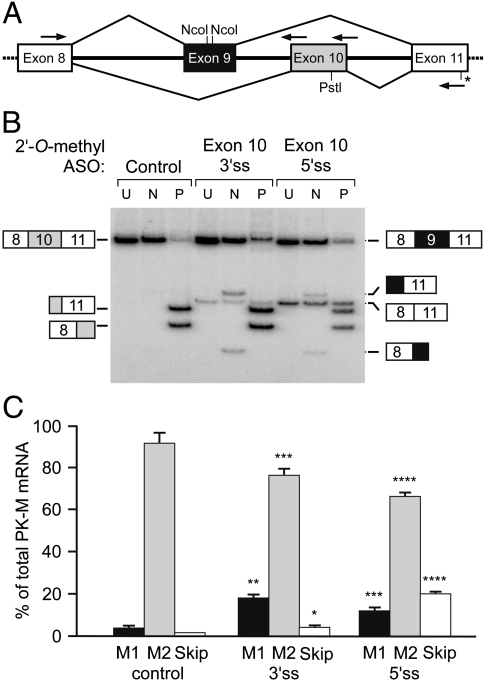
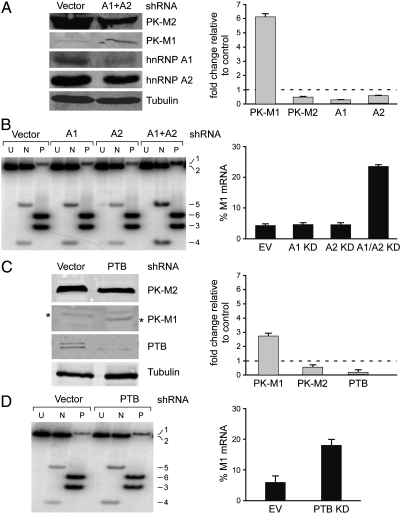
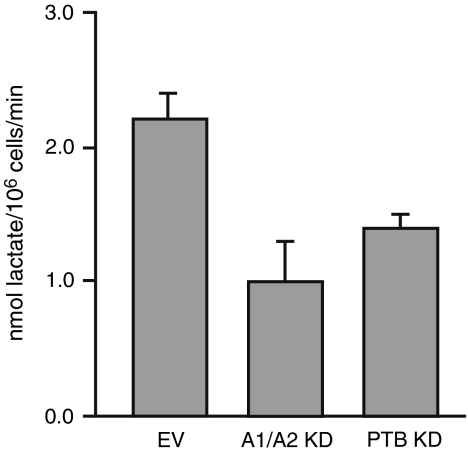
Cancer cells preferentially metabolize glucose by aerobic glycolysis, characterized by increased lactate production. This distinctive metabolism involves expression of the embryonic M2 isozyme of pyruvate kinase, in contrast to the M1 isozyme normally expressed in differentiated cells, and it confers a proliferative advantage to tumor cells. The M1 and M2 pyruvate-kinase isozymes are expressed from a single gene through alternative splicing of a pair of mutually exclusive exons. We measured the expression of M1 and M2 mRNA and protein isoforms in mouse tissues, tumor cell lines, and during terminal differentiation of muscle cells, and show that alternative splicing regulation is sufficient to account for the levels of expressed protein isoforms. We further show that the M1-specific exon is actively repressed in cancer-cell lines--although some M1 mRNA is expressed in cell lines derived from brain tumors--and demonstrate that the related splicing repressors hnRNP A1 and A2, as well as the polypyrimidine-tract-binding protein PTB, contribute to this control. Downregulation of these splicing repressors in cancer-cell lines using shRNAs rescues M1 isoform expression and decreases the extent of lactate production. These findings extend the links between alternative splicing and cancer, and begin to define some of the factors responsible for the switch to aerobic glycolysis.


Conflict of interest statement

The authors declare a conflict of interest. L.C.C. and M.G.V.H. are associated with Agios Pharmaceuticals.

Figures

Fig. 1.
Fig. 1.
Protein and transcript expression patterns of pyruvate kinase M1/M2 isoforms in cells and tissues. (A) Total adult-mouse organ/tissue homogenates were used for Western blotting with the indicated antibodies. rM1 and rM2: Flag-tagged purified recombinant human PK isoforms. (B) Total cell lysates of five human cancer-cell lines were used for Western blotting with the indicated antibodies. (C) Primers annealing to exon 8 and exon 11, respectively, were used to amplify mouse or human PK-M transcripts. The alternative exons that encode the distinctive segments of PK-M1 and PK-M2 are indicated in (black) and (gray), respectively. To distinguish between PK-M1 (exon 9 included) and PK-M2 (exon 10 included) isoforms, the PCR products were cleaved with NcoI, PstI, or both. There is an additional NcoI site (*) 11 bp away from the 3′ end of mouse exon 11. (D) Mouse organs were freshly dissected and perfused with saline. Total RNA was analyzed by radioactive RT-PCR followed by digestion with NcoI (N), PstI (P), or both enzymes (NP), plus an uncut control (U). Numbered bands are as follows: 1: Uncut M1 (502 bp); 2: uncut M2 (502 bp); 2*: M2 cleaved with NcoI in exon 11 (491 bp); 3: Pst1-cleaved M2 5’ fragment (286 bp); 4: NcoI-cleaved M1 5′ fragment (245 bp); 5: NcoI-cleaved M1 3’ fragment (240 bp); 6: PstI-cleaved M2 3’ fragment (216 bp); 7: PstI + NcoI-cleaved M2 3’ fragment (205 bp). The %M1 was quantified from band 1 (M1) and bands 3 and 6 (M2) in each P lane. (E) RT-PCR and restriction digest analysis of total RNA from the indicated human cell lines. The bands are numbered as for the mouse RT-PCR products, but the sizes are different because of the positions of the primers; the sizes are as follows: 1: 398 bp; 2: 398 bp; 3: 185 bp; 4: 144 bp; 5: 248 bp; 6: 213 bp. Note that the PK-M1 bands in the P and U lanes migrate slightly above the PK-M2 bands, which is also the case for the mouse PK-M1 transcripts.
Fig. 2.
Fig. 2.
Expression of pyruvate-kinase isoforms and selected splicing factors in cell lines and tissues. (A) Differentiation of mouse C2C12 myoblasts into myotubes. The left field shows proliferating myoblasts, and the right field shows cells after seven days in differentiation medium, when most of the cells have fused into myotubes. (B) Western blot of proliferating myoblasts versus AraC-treated myotubes with the indicated antibodies against selected splicing factors, β-catenin, total PK-M, and PK-M1 or PK-M2. (C) Radioactive RT-PCR analysis of PK-M1 and PK-M2 expression in C2C12 cells over a differentiation time course. Bands are numbered as in Fig. 1D. (D) Total cell lysates of five human-tumor or transformed cell lines were used for Western blotting with the indicated specific antibodies. Tubulin was used as an internal control for loading. HeLa (cervical carcinoma); HEK293 (transformed embryonic kidney cells); SK-NB-E (neuroblastoma); U-118MG (glioma); A-172 (glioblastoma). (E) Mouse tissues were analyzed as in Fig. 1A, with the indicated antibodies.
Fig. 3.
Fig. 3.
Exon 9 is partially rescued in HEK293 cells when exon 10 is blocked. (A) Schematic representation of the strategy used to block exon 10 with 2′-O-methyl antisense oligonucleotides. The two arrows above exon 10 denote the oligonucleotides complementary to the 3′ splice site and 5′ splice site regions. (B) Radioactive RT-PCR assay to measure PK-M1/PK-M2 levels after blocking each of the exon 10 splice sites with antisense oligonucleotides. An abnormal isoform arising from skipping of both exons 9 and 10 is indicated. (C) Quantitation of multiple experiments. (Error bars show s.d.; n = 3; p-values: = 0.007; = ∗∗0.005; = ∗∗∗0.004; = ∗∗∗∗0.001; Student’s paired t-test).
Fig. 4.
Fig. 4.
Repression of exon 9 by hnRNP proteins. (A) A-172 glioblastoma cells were transduced with retroviruses expressing hnRNPA1 and hnRNP A2 shRNAs. Total lysates were analyzed by Western blotting with the indicated antibodies. The histogram on the right shows the quantitation of multiple experiments by infrared-imaging (n = 4; error bars show s.d.; p = 0.02 (M1); p = 0.005 (M2); p = 0.05 (A1); p = 0.01 (A2); Student’s paired t-test) (B) Analysis of PK -MRNA transcripts from the cells in (A) using radioactive RT-PCR and NcoI or PstI digestion. Bands are numbered as in Fig. 1E. The histogram on the right shows the quantitation from several experiments (error bars show s.d.; n = 4; p = 10-4 for the A1/A2 double-knockdown; Student’s paired t-test) (C) and (D) As in (A) and (B) but using shRNAs against PTB (hnRNP I). (C) The * on each side indicates the band corresponding to PK-M1. The histogram on the right shows the quantitation (n = 4; error bars show s.d.; p = 0.03 (M1); p = 0.01(M2); p = 0.03 (PTB); Student’s paired t-test). (D) The histogram on the right shows the quantitation (error bars show s.d.; n = 3; p = 0.001; Student’s paired t-test).
Fig. 5.
Fig. 5.
Effect of splicing-repressor knockdown on metabolism of glioblastoma cells. Lactate production was measured in A-172 glioblastoma cells transduced with empty vector or with combined shRNAs against hnRNP A1 and A2, or against PTB. Error bars show s.d.; n = 12 for EV control, and n = 6 for A1/A2 (p = 0.0034) and PTB (p = 0.014) knockdowns; Student’s paired t-test.

Similar articles

Cited by

References

    1. Christofk HR, et al. The M2 splice isoform of pyruvate kinase is important for cancer metabolism and tumour growth. Nature. 2008;452:230–233. - PubMed
    1. Grosso AR, Martins S, Carmo-Fonseca M. The emerging role of splicing factors in cancer. EMBO Rep. 2008;9:1087–1093. - PMC - PubMed
    1. Karni R, et al. The gene encoding the splicing factor SF2/ASF is a proto-oncogene. Nat Struct Mol Biol. 2007;14:185–193. - PMC - PubMed
    1. Dombrauckas JD, Santarsiero BD, Mesecar AD. Structural basis for tumor pyruvate kinase M2 allosteric regulation and catalysis. Biochemistry. 2005;44:9417–9429. - PubMed
    1. Noguchi T, Yamada K, Inoue H, Matsuda T, Tanaka T. The L- and R-type isozymes of rat pyruvate kinase are produced from a single gene by use of different promoters. J Biol Chem. 1987;262:14366–14371. - PubMed

Publication types

MeSH terms

LinkOut - more resources