. 2010 Feb 2;107(5):2277-82.
doi: 10.1073/pnas.0909180107. Epub 2010 Jan 19.

Basic mathematical rules are encoded by primate prefrontal cortex neurons

Affiliations

Basic mathematical rules are encoded by primate prefrontal cortex neurons

Sylvia Bongard et al. Proc Natl Acad Sci U S A. .

Abstract

Mathematics is based on highly abstract principles, or rules, of how to structure, process, and evaluate numerical information. If and how mathematical rules can be represented by single neurons, however, has remained elusive. We therefore recorded the activity of individual prefrontal cortex (PFC) neurons in rhesus monkeys required to switch flexibly between "greater than" and "less than" rules. The monkeys performed this task with different numerical quantities and generalized to set sizes that had not been presented previously, indicating that they had learned an abstract mathematical principle. The most prevalent activity recorded from randomly selected PFC neurons reflected the mathematical rules; purely sensory- and memory-related activity was almost absent. These data show that single PFC neurons have the capacity to represent flexible operations on most abstract numerical quantities. Our findings support PFC network models implementing specific "rule-coding" units that control the flow of information between segregated input, memory, and output layers. We speculate that these neuronal circuits in the monkey lateral PFC could readily have been adopted in the course of primate evolution for syntactic processing of numbers in formalized mathematical systems.


Conflict of interest statement

The authors declare no conflict of interest.

Figures

Fig. 1.
Fig. 1.
Behavioral protocol. Monkeys grasped a lever and maintained central fixation. A sample numerosity was followed by a brief working memory delay (delay 1). Next, a cue indicated either the greater than or less than rule (P = 0.5 for each rule). Each rule was signified by two different sensory cues (red and water for the greater than rule, blue or no-water for the less than rule; first bifurcating arrows), followed by a rule delay (delay 2) requiring the monkeys to assess the rule at hand for the subsequent choice. For each rule, two trial types are illustrated (second bifurcating arrows). (Upper) For the greater than rule, the monkeys released the lever if more dots were shown in the first test display than in the sample display; otherwise, they held the lever until the appearance of a second test display that always required a response. (Lower) For the less than rule, the lever had to be released if the numerosity in the first test display was smaller than that in the sample display. Thus, only test 1 required a decision; test 2 was used so that a behavioral response was required on each trial, ensuring that the monkeys were paying attention during all trials.
Fig. 2.
Fig. 2.
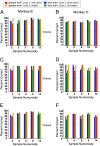
Behavioral performance. Columns show percent correct responses of the two monkeys for the greater than and less than tasks. (A and B) Performance of monkey B and monkey O during electrophysiological recordings (standard and control protocols pooled). (CF) Generalization task. Task performance of monkey B (C) and monkey O (D) in the first session with sample numerosities not previously presented. (C) Each data point (i.e., bar) represents a minimum of 4 trials and a maximum of 9 trials for monkey B. (D) For monkey O, the minimum and maximum trial counts in this first generalization session were 10 and 16 trials, respectively. Generalization performance of both monkeys to the previously unpresented sample numerosities pooled for seven (E) and six (F) sessions. Both monkeys performed significantly above chance level (50%) for all sample numerosities, cues, and rules.
Fig. 3.
Fig. 3.
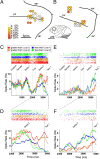
Single-cell recordings. Location of recording sites in monkey B (A) and monkey O (B). The percentage of proportion-selective units found at each recording site is color-coded. (B, Inset) Lateral view of a rhesus monkey brain. The circle indicates the location of the recording chamber. ant, anterior; iar, inferior arcuate sulcus; ps, principal sulcus; sar, superior arcuate sulcus. (C and D) Typical rule-selective example neuron 1 selective for the greater than rule toward the end of the delay 2 (second half) phase. Responses across the entire trial (C) and magnified during the delay 2 period (D) are shown. (Upper) Neuronal responses are plotted as dot-raster histograms (each dot represents an action potential, spike trains are sorted and color-coded according to the rules and rule cues). (Lower) Spike density functions (activity averaged over all trials and smoothed by a 150-ms Gaussian kernel). Rule selectivity was regardless of which cue signified the rule. (E and F) Example neuron 2 selective for the less than rule (same layout as in C and D). Only responses to correct trials are shown.
Fig. 6.
Fig. 6.
Rule selectivity during error trials. (A) Discharges of a representative neuron during a monkey’s correct vs. erroneous choices. (B) Frequency histogram of ROC values during the second half of the delay 2 phase of neurons encoding the two abstract rules during error trials.
Fig. 4.
Fig. 4.
Detailed responses of a rule-selective neuron. Spike-density histograms of a third example neuron in the delay 2 (second half) period are shown. The neuron showed higher activity to the greater than rule, irrespective of whether sample numerosity 2 (A), 3, (B), 5 (C), 8 (D), or 13 (E) was shown. (F) Average discharges across all sample numerosities. Only responses to correct trials are shown.
Fig. 5.
Fig. 5.
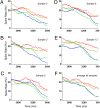
PFC neurons encode the greater than and less than rules. (A) Frequency histogram of ROC values of neurons encoding the abstract quantitative rules during correct trials in the delay 2 (second half) period. (B) Temporal evolution of rule-selective signals in the second half of the delay 2 period. Each row in the color map represents rule-selective coding for an individual neuron, with neurons preferring greater than (red) and less than (blue) sorted in opposite order according to the first time point where the ROC value significantly differed from 0.5. White curves depict the neurons’ latency for rule selectivity. Time 0 ms is the onset of the delay 2 period. Average ROC values are shown as a function of time during delay 2 (second half) for all neurons preferring the greater than (C) or less than (D) rule.

Similar articles

Cited by

References

    1. Whitehead AN, Russell B. Principia Mathematica. Vol. 1. Cambridge, UK: Cambridge Univ Press; 1910.
    1. Whitehead AN, Russell B. Principia Mathematica. Vol. 2. Cambridge, UK: Cambridge Univ Press; 1912.
    1. Whitehead AN, Russell B. Principia Mathematica. Vol. 3. Cambridge, UK: Cambridge Univ Press; 1913.
    1. Danzig T. Number, the Language of Science. New York: Free; 1954.
    1. Dehaene S. The Number Sense. New York: Oxford Univ Press; 1997.

Publication types