Plasminogen activator inhibitor-1 regulates myoendothelial junction formation
- PMID: 20133900
- PMCID: PMC2848897
- DOI: 10.1161/CIRCRESAHA.109.215723
Plasminogen activator inhibitor-1 regulates myoendothelial junction formation
Abstract
Rationale: Plasminogen activator inhibitor-1 (PAI-1) is a biomarker for several vascular disease states; however, its target of action within the vessel wall is undefined.
Objective: Determine the ability of PAI-1 to regulate myoendothelial junction (MEJ) formation.
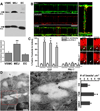
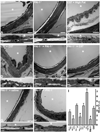
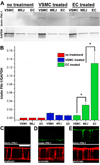
Methods and results: MEJs are found throughout the vasculature linking endothelial cells (ECs) and vascular smooth muscle cells. Using a vascular cell coculture we isolated MEJ fractions and performed two-dimensional differential gel electrophoresis. Mass spectrometry identified PAI-1 as being enriched within MEJ fractions, which we confirmed in vivo. In the vascular cell coculture, recombinant PAI-1 added to the EC monolayer significantly increased MEJs. Conversely, addition of a PAI-1 monoclonal antibody to the EC monolayer reduced the number of MEJs. This was also observed in vivo where mice fed a high fat diet had increased PAI-1 and MEJs and the number of MEJs in coronary arterioles of PAI-1(-/-) mice was significantly reduced when compared to C57Bl/6 mice. The presence of MEJs in PAI-1(-/-) coronary arterioles was restored when their hearts were transplanted into and exposed to the circulation of C57Bl/6 mice. Application of biotin-conjugated PAI-1 to the EC monolayer in vitro confirmed the ability of luminal PAI-1 to translocate to the MEJ. Functionally, phenylephrine-induced heterocellular calcium communication in the vascular cell coculture was temporally enhanced when recombinant PAI-1 was present, and prolonged when PAI-1 was absent.
Conclusion: Our data implicate circulating PAI-1 as a key regulator of MEJ formation and a potential target for pharmacological intervention in diseases with vascular abnormalities (eg, diabetes mellitus).
Figures


Comment in
-
Regulation of myoendothelial junction formation: bridging the gap.Circ Res. 2010 Apr 2;106(6):1014-6. doi: 10.1161/CIRCRESAHA.110.217786. Circ Res. 2010. PMID: 20360262 Free PMC article. No abstract available.
Similar articles
-
A novel mRNA binding protein complex promotes localized plasminogen activator inhibitor-1 accumulation at the myoendothelial junction.Arterioscler Thromb Vasc Biol. 2012 May;32(5):1271-9. doi: 10.1161/ATVBAHA.112.246371. Epub 2012 Mar 1. Arterioscler Thromb Vasc Biol. 2012. PMID: 22383705 Free PMC article.
-
Site-specific connexin phosphorylation is associated with reduced heterocellular communication between smooth muscle and endothelium.J Vasc Res. 2010;47(4):277-86. doi: 10.1159/000265562. Epub 2009 Dec 16. J Vasc Res. 2010. PMID: 20016202 Free PMC article.
-
Heterocellular Contact Can Dictate Arterial Function.Circ Res. 2019 May 10;124(10):1473-1481. doi: 10.1161/CIRCRESAHA.118.313926. Circ Res. 2019. PMID: 30900949 Free PMC article.
-
Endothelium-Dependent Hyperpolarization: The Evolution of Myoendothelial Microdomains.J Cardiovasc Pharmacol. 2021 Dec 1;78(Suppl 6):S3-S12. doi: 10.1097/FJC.0000000000001087. J Cardiovasc Pharmacol. 2021. PMID: 34840265 Review.
-
Integration of non-SMAD and SMAD signaling in TGF-beta1-induced plasminogen activator inhibitor type-1 gene expression in vascular smooth muscle cells.Thromb Haemost. 2008 Dec;100(6):976-83. Thromb Haemost. 2008. PMID: 19132220 Free PMC article. Review.
Cited by
-
Endothelial cell expression of haemoglobin α regulates nitric oxide signalling.Nature. 2012 Nov 15;491(7424):473-7. doi: 10.1038/nature11626. Epub 2012 Oct 31. Nature. 2012. PMID: 23123858 Free PMC article.
-
Role of plasminogen activator inhibitor-1 in senescence and aging.Semin Thromb Hemost. 2014 Sep;40(6):645-51. doi: 10.1055/s-0034-1387883. Epub 2014 Aug 31. Semin Thromb Hemost. 2014. PMID: 25173500 Free PMC article. Review.
-
Polarized Proteins in Endothelium and Their Contribution to Function.J Vasc Res. 2021;58(2):65-91. doi: 10.1159/000512618. Epub 2021 Jan 27. J Vasc Res. 2021. PMID: 33503620 Free PMC article. Review.
-
Compartmentalized nitric oxide signaling in the resistance vasculature.Nitric Oxide. 2015 Sep 15;49:8-15. doi: 10.1016/j.niox.2015.05.003. Epub 2015 May 28. Nitric Oxide. 2015. PMID: 26028569 Free PMC article. Review.
-
Wall shear stress effects on endothelial-endothelial and endothelial-smooth muscle cell interactions in tissue engineered models of the vascular wall.PLoS One. 2014 Feb 10;9(2):e88304. doi: 10.1371/journal.pone.0088304. eCollection 2014. PLoS One. 2014. PMID: 24520363 Free PMC article.
References
-
- Alessi MC, Juhan-Vague I. Metabolic syndrome, haemostasis and thrombosis. Thromb Haemost. 2008;99:995–1000. - PubMed
-
- Lijnen HR. Pleiotropic functions of plasminogen activator inhibitor-1. J Thromb Haemost. 2005;3:35–45. - PubMed
-
- Eddy AA, Giachelli CM. Renal expression of genes that promote interstitial inflammation and fibrosis in rats with protein-overload proteinuria. Kidney Int. 1995;47:1546–1557. - PubMed
-
- Hirano T, Kashiwazaki K, Moritomo Y, Nagano S, Adachi M. Albuminuria is directly associated with increased plasma PAI-1 and factor VII levels in NIDDM patients. Diabetes Res Clin Pract. 1997;36:11–18. - PubMed
Publication types
MeSH terms
Substances
Grants and funding
LinkOut - more resources
Full Text Sources
Other Literature Sources
Molecular Biology Databases
Miscellaneous

