Aortic arch curvature and atherosclerosis have overlapping quantitative trait loci in a cross between 129S6/SvEvTac and C57BL/6J apolipoprotein E-null mice
- PMID: 20133902
- PMCID: PMC2848914
- DOI: 10.1161/CIRCRESAHA.109.207175
Aortic arch curvature and atherosclerosis have overlapping quantitative trait loci in a cross between 129S6/SvEvTac and C57BL/6J apolipoprotein E-null mice
Abstract
Rationale: Apolipoprotein E-null mice with a 129S6/SvEvTac strain background (129-apoE) develop atherosclerotic plaques faster in the aortic arch but slower in the aortic root than those with a C57BL/6J background (B6-apoE). The shape of the aortic arch also differs in the 2 strains.
Objective: Because circulating plasma factors are the same at both locations, we tested the hypothesis that genetic factors affecting vascular geometry also affect the location and extent of atherosclerotic plaque development.
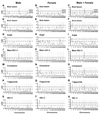
Methods and results: Tests on the F2 progeny from a cross between 129-apoE-null and B6-apoE-null mice showed that the extent of atherosclerosis in the aortic arch is significantly correlated in males, but not in females, with the shape of arch curvature (r=0.34, P<0.0001) and weakly with the arch diameter (r=0.20, P=0.02). Quantitative trait locus (QTL) analysis identified 2 significant peaks for aortic arch lesion size on chromosome 1 (105 Mb, LOD=5.0, and 163 Mb, LOD=6.8), and a suggestive QTL on chromosome 15 (96 Mb, LOD=4.7). A significant QTL for aortic root lesion size was on chromosome 9 (61 Mb, LOD=6.9), but it was distinct from the QTLs for arch lesion size. Remarkably, the QTLs for susceptibility to atherosclerosis in the arch overlapped with a significant QTL that affects curvature of the arch on chromosome 1 (121 Mb, LOD=5.6) and a suggestive QTL on chromosome 15 (76 Mb, LOD=3.5).
Conclusions: The overlapping QTLs for curvature of the aortic arch and atherosclerosis support that the ontogeny of the aortic arch formation is a potential risk factor for atherosclerosis.
Figures


References
-
- Malek AM, Alper SL, Izumo S. Hemodynamic shear stress and its role in atherosclerosis. JAMA. 1999;282:2035–2042. - PubMed
-
- Friedman MH, Deters OJ, Mark FF, Bargeron CB, Hutchins GM. Arterial geometry affects hemodynamics. A potential risk factor for athersoclerosis. Atherosclerosis. 1983;46:225–231. - PubMed
-
- Zhang SH, Reddick RL, Piedrahita JA, Maeda N. Spontaneous hypercholesterolemia and arterial lesions in mice lacking apolipoprotein E. Science. 1992;258:468–471. - PubMed
Publication types
MeSH terms
Substances
Grants and funding
LinkOut - more resources
Full Text Sources
Medical
Molecular Biology Databases
Miscellaneous

