. 2010 Apr 2;106(6):1040-51.
doi: 10.1161/CIRCRESAHA.109.201103. Epub 2010 Feb 4.

Activation of the ROCK1 branch of the transforming growth factor-beta pathway contributes to RAGE-dependent acceleration of atherosclerosis in diabetic ApoE-null mice

Affiliations

Activation of the ROCK1 branch of the transforming growth factor-beta pathway contributes to RAGE-dependent acceleration of atherosclerosis in diabetic ApoE-null mice

De-xiu Bu et al. Circ Res. .

Abstract

Rationale: The multiligand RAGE (receptor for advanced glycation end products) contributes to atherosclerosis in apolipoprotein (Apo)E-null mice.

Objective: To delineate the specific mechanisms by which RAGE accelerated atherosclerosis, we performed Affymetrix gene expression arrays on aortas of nondiabetic and diabetic ApoE-null mice expressing RAGE or devoid of RAGE at nine weeks of age, as this reflected a time point at which frank atherosclerotic lesions were not yet present, but that we would be able to identify the genes likely involved in diabetes- and RAGE-dependent atherogenesis.

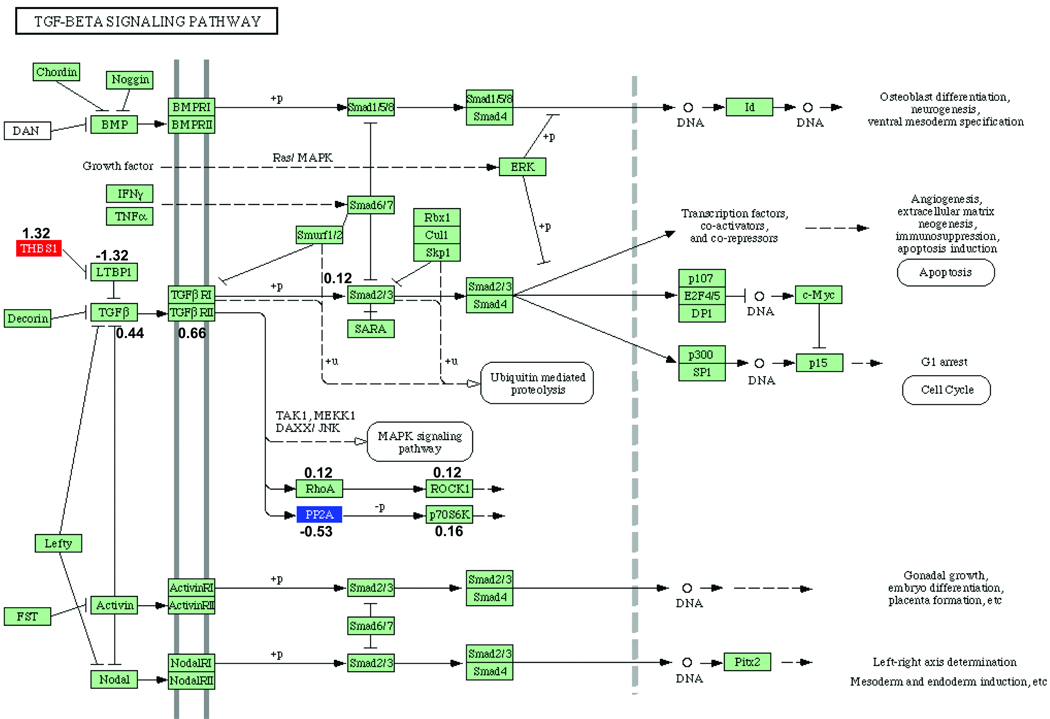
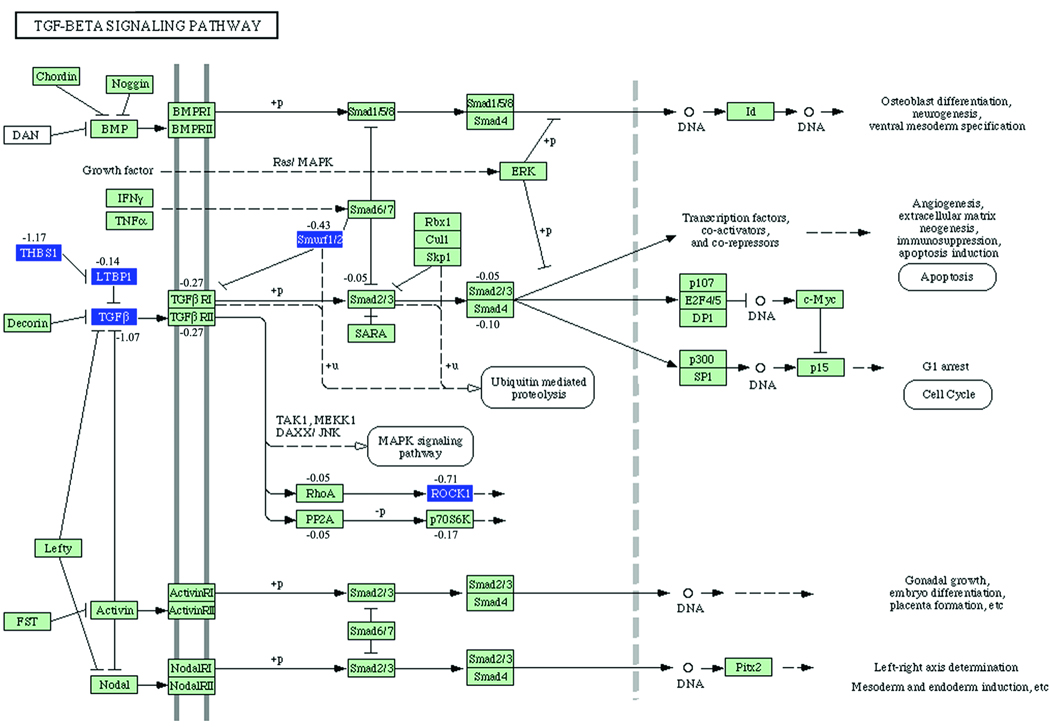
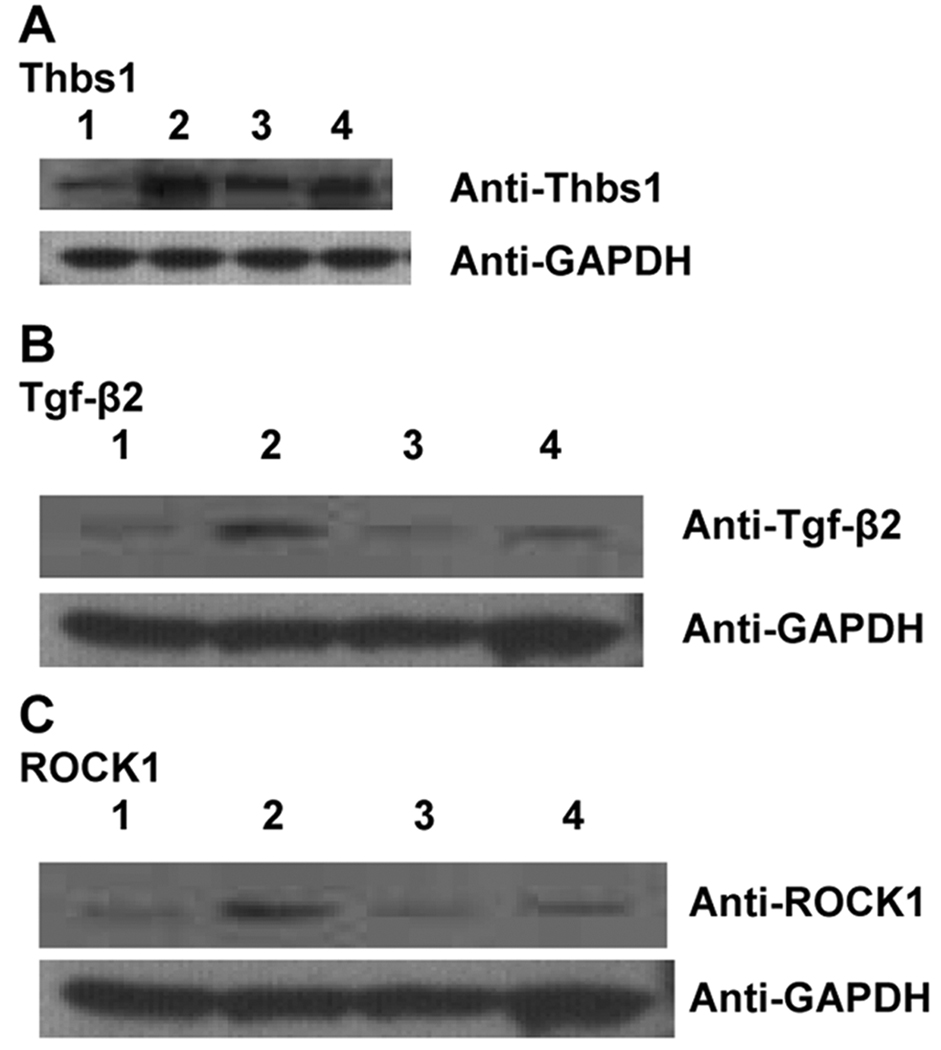
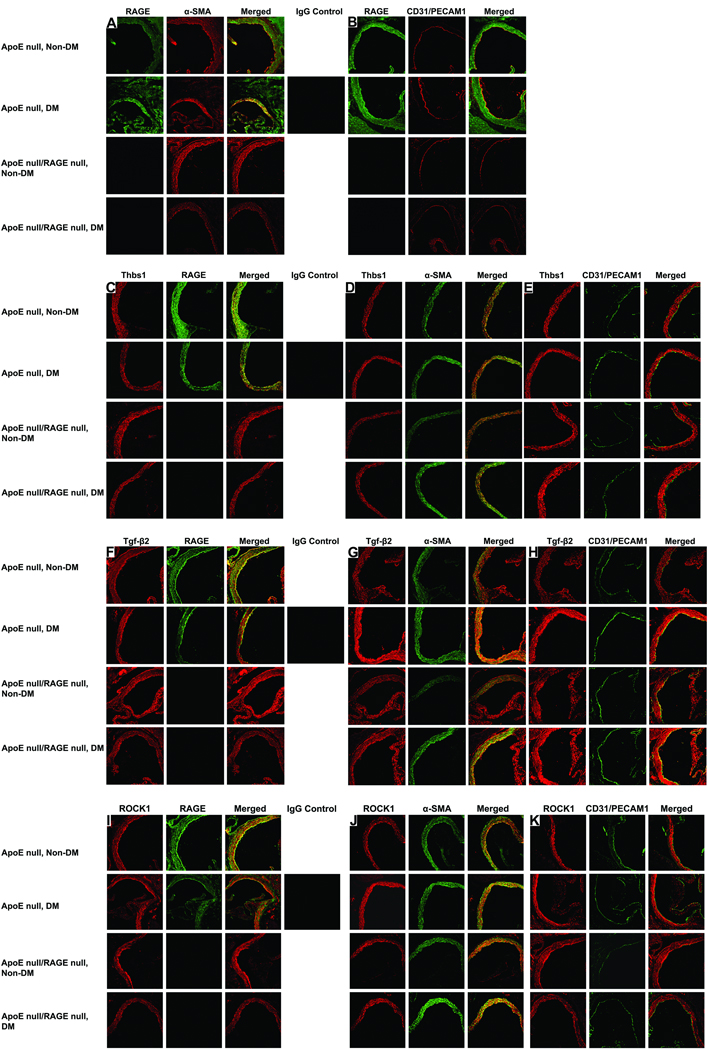
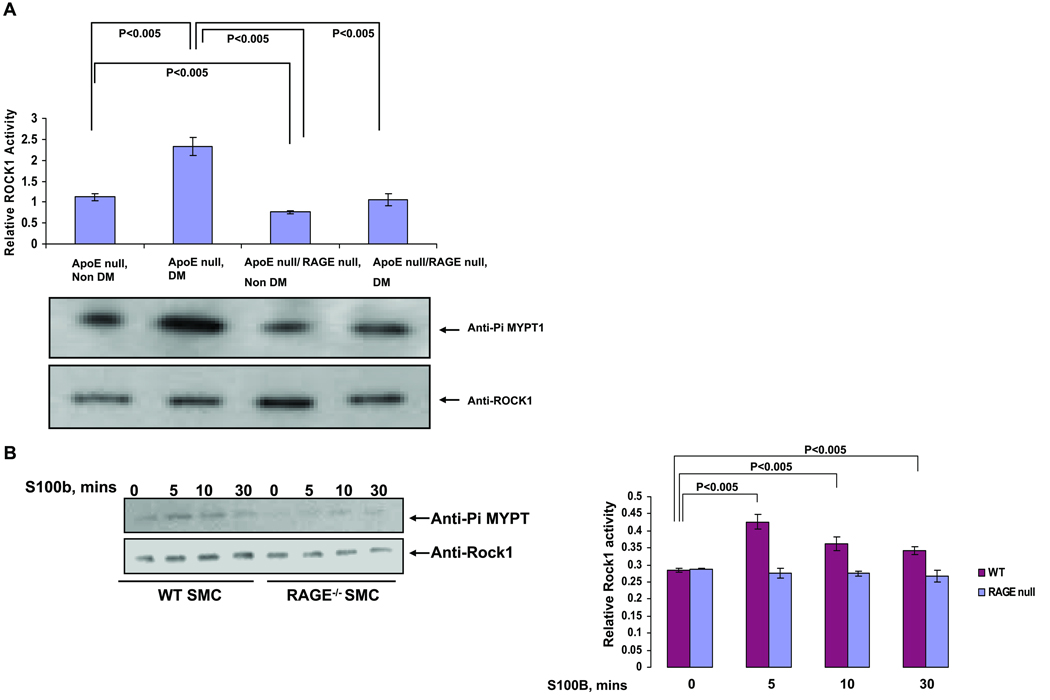
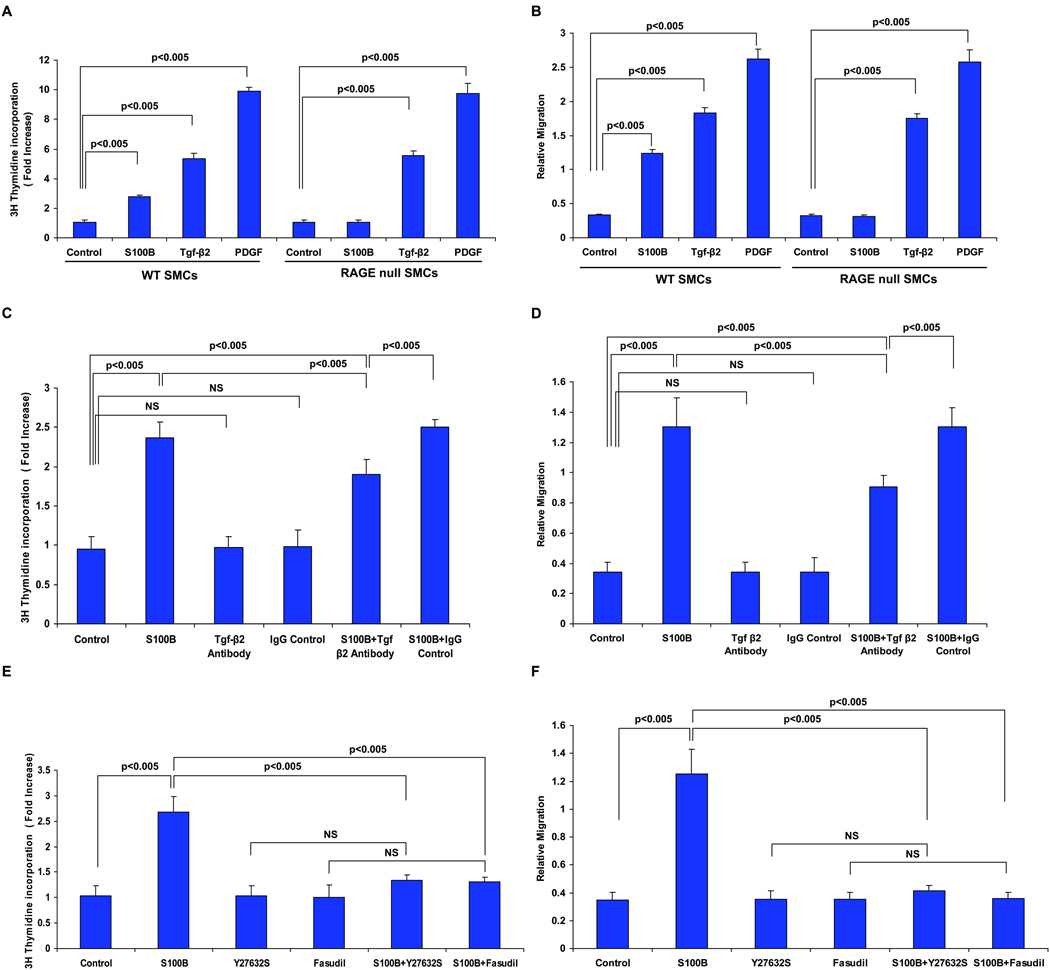
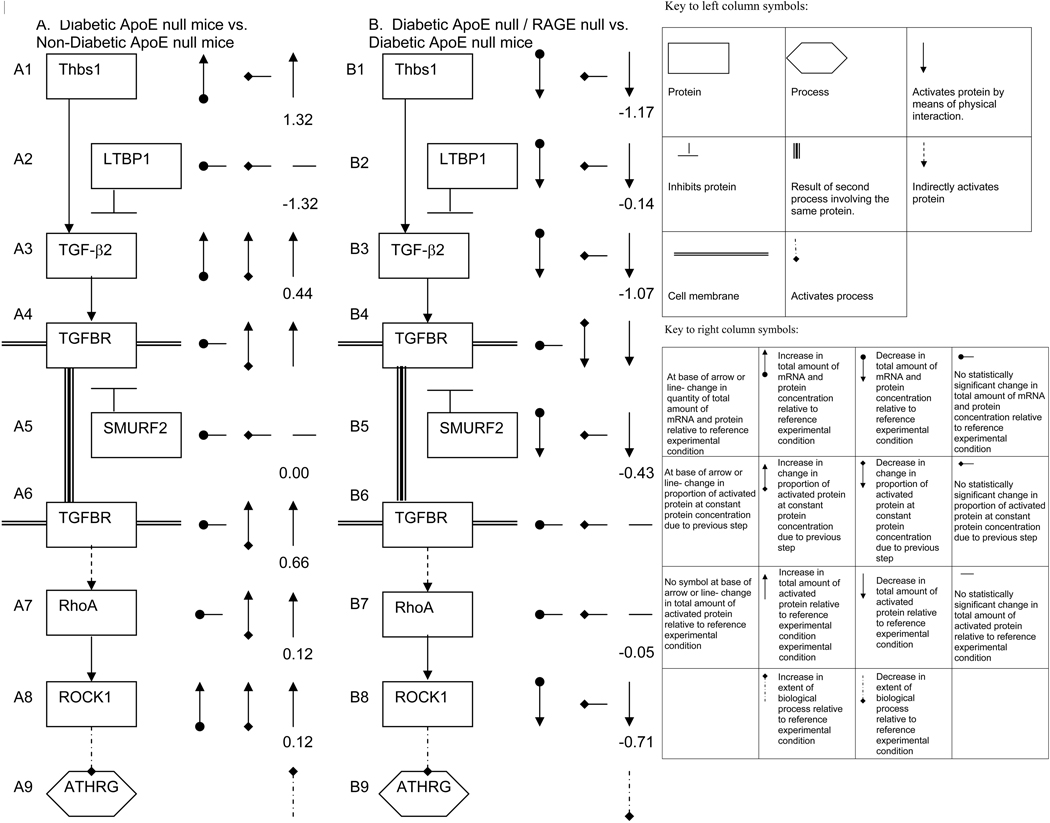
Methods and results: We report that there is very little overlap of the genes that are differentially expressed both in the onset of diabetes in ApoE-null mice, and in the effect of RAGE deletion in diabetic ApoE-null mice. Pathway-Express analysis revealed that the transforming growth factor-beta pathway and focal adhesion pathways might be expected to play a significant role in both the mechanism by which diabetes facilitates the formation of atherosclerotic plaques in ApoE-null mice, and the mechanism by which deletion of RAGE ameliorates this effect. Quantitative polymerase chain reaction studies, Western blotting, and confocal microscopy in aortic tissue and in primary cultures of murine aortic smooth muscle cells supported these findings.

Conclusions: Taken together, our work suggests that RAGE-dependent acceleration of atherosclerosis in ApoE-null mice is dependent, at least in part, on the action of the ROCK1 (rho-associated protein kinase 1) branch of the transforming growth factor-beta pathway.


Figures

Figure 1
Figure 1. Tgf-β KEGG Pathway analysis: effect of diabetes in ApoE null mice
Gene symbols that are colored reflect genes that are statistically significantly differentially expressed in ApoE null mice with diabetes relative to non-diabetic ApoE null mice. Up-regulated genes are shown in red, and down-regulated genes are shown in blue. Numbers indicate perturbation factors (which may be different in magnitude and even in sign than fold-changes). KEGG Pathways often represent several different and related proteins by a single protein [for example, Tgf-β1, Tgf-β2, and Tgf-β3 are all represented as Tgf-β]). In such a case, the perturbation factor for the product of the gene with non-zero fold change is given.
Figure 2
Figure 2. Tgf-β KEGG Pathway analysis: effect of deletion of RAGE in diabetic ApoE null mice
Gene symbols that are colored reflect genes that are statistically significantly differentially expressed in diabetic ApoE null/RAGE null mice relative to diabetic ApoE null mice. Up-regulated genes are shown in red, and down-regulated genes are shown in blue. Numbers indicate perturbation factors as in Figure 1.
Figure 3
Figure 3. Regulation of Thbs1, TGFβ-2 and ROCK1 protein in ApoE null mouse aorta
Total aorta tissue was lysed and subjected to Western blotting as described above using primary antibodies for detection of Thbs1 (A), Tgf-β2 (B) and ROCK1 (C). After probing with the primary antibody, membranes were stripped and re-probed with antibodies to detect GAPDH. In each case, lane 1 represents non-diabetic ApoE null; lane 2 represents diabetic ApoE null; lane 3 represents non-diabetic ApoE null/RAGE null and lane 4 represents diabetic ApoE null/RAGE null. Statistical analyses are illustrated in Table 1.
Figure 4
Figure 4. Localization of RAGE, Thbs1, Tgf-β2 and ROCK1 antigens in the aortas of non-diabetic and diabetic ApoE null and ApoE null/RAGE null mice
Confocal microscopy was performed on aorta tissue and subjected to immunostaining for detection of the indicated antigens. (A). Left column reveals staining with a RAGE specific antibody. Middle column reveals staining with monoclonal mouse smooth muscle actin antibody specific to smooth muscle cell α-actin. Right column reveals the merge of left and right column images. (B). Left column reveals staining with RAGE-specific antibody. Middle column reveals staining with antibody specific for CD31/PECAM1. Right column reveals the merge of left and right column images. Single black square reveals staining with nonimmune IgG control. (C). Left column reveals staining with a Thbs1 specific antibody. Middle column reveals staining with RAGE specific antibody. Right column reveals the merge of left and right column images. (D). Left column reveals staining with Thbs1-specific antibody. Middle column reveals staining with smooth muscle cell specific antibody. Right column reveals the merge of left and right column images. (E). Left column reveals staining with Thbs1 specific antibody. Middle column reveals staining with CD31/PECAM specific antibody. Right column reveals merge of left and right column images. Single black square reveals staining with nonimmune IgG control. (F). Left column reveals staining with a Tgf-β2 specific antibody. Middle column reveals staining with RAGE specific antibody. Right column reveals the merge of left and right column images. (G). Left column reveals staining with Tgf-β2 specific antibody. Middle column reveals staining with smooth muscle cell specific antibody. Right column reveals the merge of left and right column images. (H). Left column reveals staining with Tgf-β2 specific antibody. Middle column reveals staining with CD31/PECAM1 specific antibody. Right column reveals merge of left and right column images. Single black square reveals staining with nonimmune IgG control. (I). Left column reveals staining with a ROCK1 specific antibody. Middle column reveals staining with RAGE specific antibody. Right column reveals the merge of left and right column images. (J). Left column reveals staining with ROCK1 specific antibody. Middle column reveals staining with smooth muscle cell specific antibody. Right column reveals the merge of left and right column images. (K). Left column reveals staining with ROCK1 specific antibody. Middle column reveals staining with CD31/PECAM1 specific antibody. Right column reveals merge of left and right column images. Single black square reveals staining with nonimmune IgG control. Original magnifications: x200.
Figure 5
Figure 5. ROCK1 activation in ApoE null aorta and primary SMCs: effect of RAGE
Aortas were retrieved from the indicated mice at age 9 weeks (A) or primary murine aortic SMCs were treated with S100B (10 µg/ml) for the indicated times (B). Lysates were prepared and ROCK1 activity determined. Statistical considerations from at least n=3 distinct experiments are indicated.
Figure 6
Figure 6. RAGE ligands modulate SMC proliferation and migration: requirement for Tgf-β and ROCK
A&B. Wild-type and RAGE-deficient SMCs were treated with S100B (10 µg/ml), Tgf-β (10 ng/ml) or PDGF (10 ng/ml) for 5 or 48 hrs and at the end of that time proliferation (A) and migration (B) were assessed. Note that when comparing migration and proliferation responses to S100B between wild-type and RAGE null SMCs; p<0.05. In C&D, wild-type SMCs were pre-treated anti-Tgf-β antibody or irrelevant IgG control antibody (10 µg/ml) followed by assessment of S100B-stimulated proliferation and migration. In E&F, wild-type SMCs were pre-treated with Y27632 (X10 µM) or fasudil (10 µM) followed by S100B (10 µg/ml) and proliferation and migration were monitored. Statistical considerations from at least n=3 distinct assays are shown.
Figure 7
Figure 7. Proposed mechanism by which diabetes and RAGE contribute to atherosclerosis in ApoE null mice
Based on in-depth analysis of microarray findings, we speculate on the mechanisms by which diabetes accelerates atherosclerosis in ApoE null mice (A) and by which RAGE accelerates atherosclerosis in diabetic ApoE null mice (B). In both cases, the left column represents the pathway, and the right column represents the observed change in concentration of mRNA and protein and inferred change in activation of proteins and processes. Numbers accompanying each molecular step are Pathway Express perturbation factors. Note that Tgf-βR appears in two steps for the sake of reliability, but only has one perturbation factor, as any other protein in the pathway.

Similar articles

Cited by

References

    1. Park L, Raman KG, Lee KJ, Lu Y, Ferran LJ, Chow WS, Stern D, Schmidt AM. Suppression of accelerated diabetic atherosclerosis by the soluble receptor for advanced glycation endproducts. Nat Med. 1998;4:1025–1031. - PubMed
    1. Kislinger T, Tanji N, Wendt T, Qu W, Lu Y, Ferran LJ, Jr, Taguchi A, Olson K, Bucciarelli L, Goova M, Hofmann MA, Cataldegirmen G, D'Agati V, Pischetsrieder M, Stern DM, Schmidt AM. Receptor for advanced glycation endproducts mediates inflammation and enhanced expression of tissue factor in vasculature of diabetic apolipoprotein E null mice. Arterioscler Thromb Vasc Biol. 2001;21:905–910. - PubMed
    1. Bucciarelli LG, Wendt T, Qu W, Lu Y, Lalla E, Rong LL, Goova MT, Moser B, Kislinger T, Lee DC, Kashypa Y, Stern DM, Schmidt AM. RAGE blockade stabilizes established atherosclerosis in diabetic apolipoprotein E null mice. Circ. 2002;106:2827–2835. - PubMed
    1. Wendt T, Harja E, Bucciarelli L, Qu W, Lu Y, Rong LL, Jenkins DG, Stein G, Schmidt AM, Yan SF. RAGE modulates vascular inflammation and atherosclerosis in a murine model of type 2 diabetes. Atherosclerosis. 2006;185:70–77. - PubMed
    1. Harja E, Bu DX, Hudson BI, Chang JS, Shen X, Hallam K, Kalea AZ, Lu Y, Rosario RH, Oruganti S, Nikolla Z, Belov D, Lalla E, Ramasamy R, Yan SF, Schmidt AM. Vascular and inflammatory stresses mediate atherosclerosis via RAGE and its ligands in apoE −/− mice. J Clin Invest. 2008;118:183–194. - PMC - PubMed

MeSH terms