

Chronic cigarette smoke exposure generates pathogenic T cells capable of driving COPD-like disease in Rag2-/- mice
- PMID: 20133926
- PMCID: PMC2891493
- DOI: 10.1164/rccm.200910-1485OC
Chronic cigarette smoke exposure generates pathogenic T cells capable of driving COPD-like disease in Rag2-/- mice
Abstract
Rationale: Pathogenic T cells drive, or sustain, a number of inflammatory diseases. Chronic obstructive pulmonary disease (COPD) is an inflammatory lung disease associated with the accumulation of activated T cells. We previously demonstrated that chronic cigarette smoke (CS) exposure causes oligoclonal expansion of lung CD4(+) T cells and CD8(+) T cells in a mouse model of COPD, thus implicating these cells in disease pathogenesis.
Objectives: To determine whether T cells are pathogenic in a CS-induced mouse model of COPD.
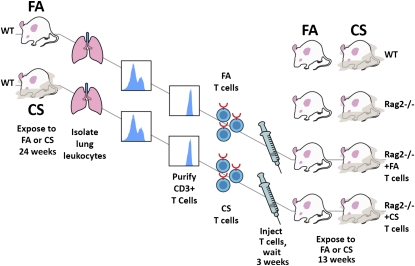
Methods: We transferred lung CD3(+) T cells from filtered air (FA)- and CS-exposed mice into Rag2(-/-) recipients. Endpoints associated with the COPD phenotype were then measured.
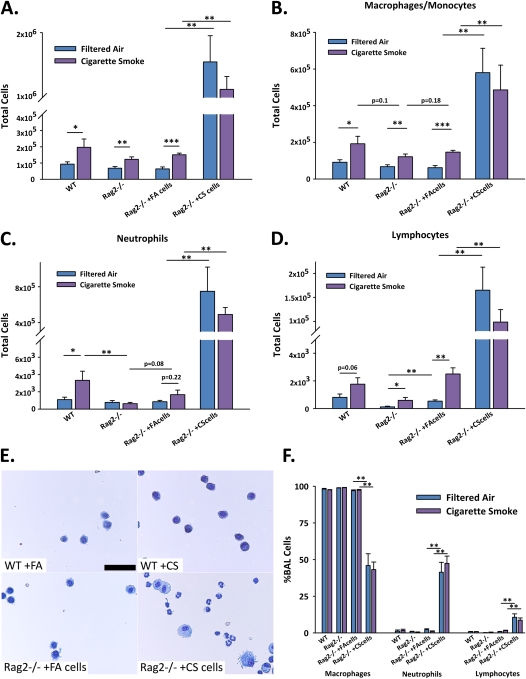
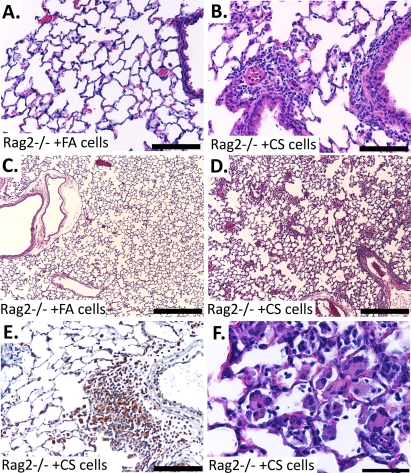
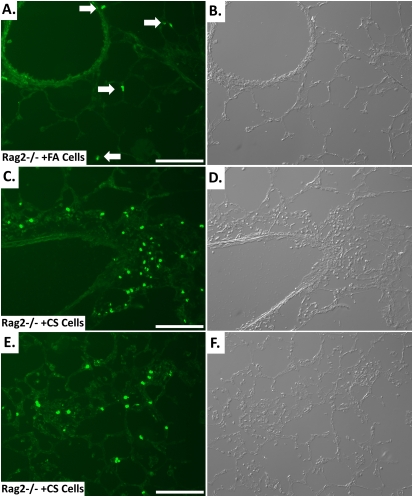
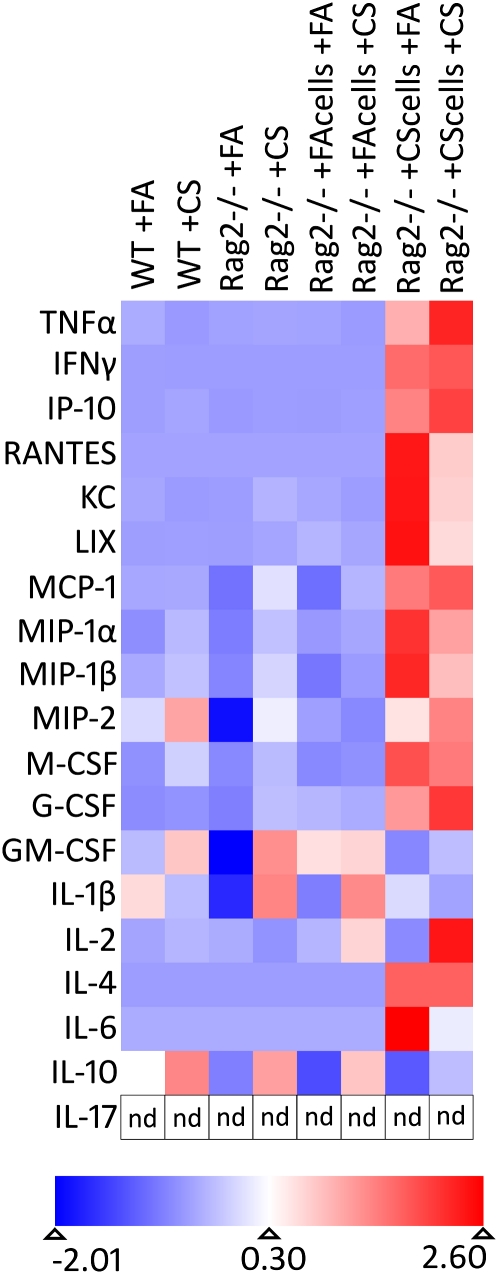
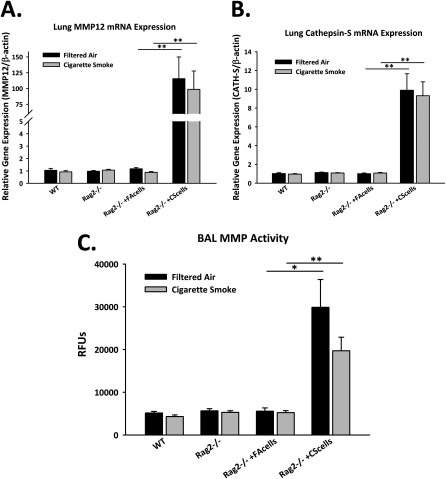
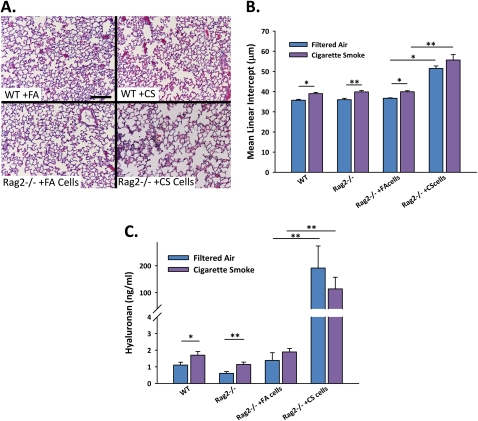
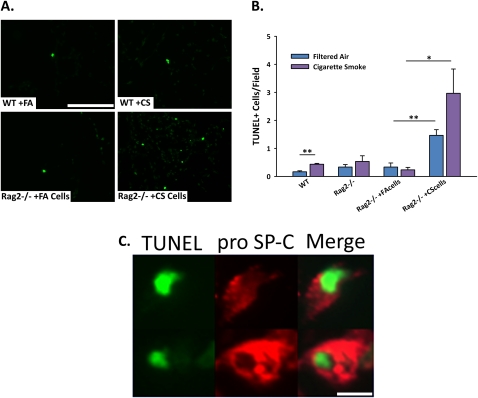
Measurements and main results: Here, we demonstrate that chronic CS exposure generates pathogenic T cells. Transfer of CD3(+) T cells from the lungs of CS-exposed mice into Rag2(-/-) recipients led to substantial pulmonary changes pathognomonic of COPD. These changes included monocyte/macrophage and neutrophil accumulation, increased expression of cytokines and chemokines, activation of proteases, apoptosis of alveolar epithelial cells, matrix degradation, and airspace enlargement reminiscent of emphysema.
Conclusions: These data formally demonstrate, for the first time, that chronic CS exposure leads to the generation of pathogenic T cells capable of inducing COPD-like disease in Rag2(-/-) mice. This report provides novel insights into COPD pathogenesis.
Figures
Similar articles
-
Cigarette smoke-induced iBALT mediates macrophage activation in a B cell-dependent manner in COPD.Am J Physiol Lung Cell Mol Physiol. 2014 Nov 1;307(9):L692-706. doi: 10.1152/ajplung.00092.2014. Epub 2014 Aug 15. Am J Physiol Lung Cell Mol Physiol. 2014. PMID: 25128521
-
Cigarette smoke-induced pulmonary inflammation and emphysema are attenuated in CCR6-deficient mice.J Immunol. 2006 Oct 1;177(7):4350-9. doi: 10.4049/jimmunol.177.7.4350. J Immunol. 2006. PMID: 16982869
-
Functional characterization of T cell populations in a mouse model of chronic obstructive pulmonary disease.J Immunol. 2013 Feb 1;190(3):1331-40. doi: 10.4049/jimmunol.1202442. Epub 2012 Dec 21. J Immunol. 2013. PMID: 23264660 Free PMC article.
-
Inflammatory cells and chronic obstructive pulmonary disease.Curr Drug Targets Inflamm Allergy. 2005 Dec;4(6):607-18. doi: 10.2174/156801005774912824. Curr Drug Targets Inflamm Allergy. 2005. PMID: 17305517 Review.
-
State of the art. Mechanistic heterogeneity in chronic obstructive pulmonary disease: insights from transgenic mice.Proc Am Thorac Soc. 2006 Aug;3(6):494-8. doi: 10.1513/pats.200603-068MS. Proc Am Thorac Soc. 2006. PMID: 16921126 Review.
Cited by
-
Contribution of adaptive immunity to human COPD and experimental models of emphysema.Physiol Rev. 2023 Apr 1;103(2):1059-1093. doi: 10.1152/physrev.00036.2021. Epub 2022 Oct 6. Physiol Rev. 2023. PMID: 36201635 Free PMC article. Review.
-
Natural and disease-specific autoantibodies in chronic obstructive pulmonary disease.Clin Exp Immunol. 2015 Apr;180(1):155-63. doi: 10.1111/cei.12565. Clin Exp Immunol. 2015. PMID: 25469980 Free PMC article. Clinical Trial.
-
Incidence and mortality of obstructive lung disease in rheumatoid arthritis: a population-based study.Arthritis Care Res (Hoboken). 2013 Aug;65(8):1243-50. doi: 10.1002/acr.21986. Arthritis Care Res (Hoboken). 2013. PMID: 23436637 Free PMC article.
-
Smoking: effects on multiple sclerosis susceptibility and disease progression.Ther Adv Neurol Disord. 2012 Jan;5(1):13-22. doi: 10.1177/1756285611425694. Ther Adv Neurol Disord. 2012. PMID: 22276073 Free PMC article.
-
Inflammaging increases susceptibility to cigarette smoke-induced COPD.Oncotarget. 2016 May 24;7(21):30068-83. doi: 10.18632/oncotarget.4027. Oncotarget. 2016. PMID: 26284585 Free PMC article.
References
-
- Cosio MG, Saetta M, Agusti A. Immunologic aspects of chronic obstructive pulmonary disease. N Engl J Med 2009;360:2445–2454. - PubMed
-
- Aubry MC, Wright JL, Myers JL. The pathology of smoking-related lung diseases. Clin Chest Med 2000;21:11–35. - PubMed
-
- Ryu JH, Colby TV, Hartman TE, Vassallo R. Smoking-related interstitial lung diseases: a concise review. Eur Respir J 2001;17:122–132. - PubMed
-
- Rabe KF, Hurd S, Anzueto A, Barnes PJ, Buist SA, Calverley P, Fukuchi Y, Jenkins C, Rodriguez-Roisin R, van Weel C, et al. Global strategy for the diagnosis, management, and prevention of chronic obstructive pulmonary disease: GOLD executive summary. Am J Respir Crit Care Med 2007;176:532–555. - PubMed
Publication types
MeSH terms
Substances
Grants and funding
LinkOut - more resources
Full Text Sources
Other Literature Sources
Medical
Research Materials
