Developmental silencing of human zeta-globin gene expression is mediated by the transcriptional repressor RREB1
- PMID: 20133935
- PMCID: PMC2856224
- DOI: 10.1074/jbc.M109.049130
Developmental silencing of human zeta-globin gene expression is mediated by the transcriptional repressor RREB1
Abstract
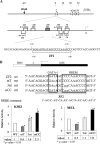
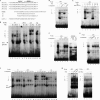
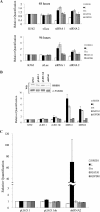
The mammalian embryonic zeta-globin genes, including that of humans, are expressed at the early embryonic stage and then switched off during erythroid development. This autonomous silencing of the zeta-globin gene transcription is probably regulated by the cooperative work of various protein-DNA and protein-protein complexes formed at the zeta-globin promoter and its upstream enhancer (HS-40). We present data here indicating that a protein-binding motif, ZF2, contributes to the repression of the HS-40-regulated human zeta-promoter activity in erythroid cell lines and in transgenic mice. Combined site-directed mutagenesis and EMSA suggest that repression of the human zeta-globin promoter is mediated through binding of the zinc finger factor RREB1 to ZF2. This model is further supported by the observation that human zeta-globin gene transcription is elevated in the human erythroid K562 cell line or the primary erythroid culture upon RNA interference (RNAi)(2) knockdown of RREB1 expression. These data together suggest that RREB1 is a putative repressor for the silencing of the mammalian zeta-globin genes during erythroid development. Because zeta-globin is a powerful inhibitor of HbS polymerization, our experiments have provided a foundation for therapeutic up-regulation of zeta-globin gene expression in patients with severe hemoglobinopathies.
Figures


Similar articles
-
Transcriptional activation of human zeta 2 globin promoter by the alpha globin regulatory element (HS-40): functional role of specific nuclear factor-DNA complexes.Mol Cell Biol. 1993 Apr;13(4):2298-308. doi: 10.1128/mcb.13.4.2298-2308.1993. Mol Cell Biol. 1993. PMID: 8455611 Free PMC article.
-
DNA-protein interactions in the proximal zeta-globin promoter: identification of novel CCACCC- and CCAAT-binding proteins.Blood Cells Mol Dis. 1998 Jun;24(2):183-98. doi: 10.1006/bcmd.1998.0185. Blood Cells Mol Dis. 1998. PMID: 9642099
-
Identification of upstream regulatory elements that repress expression of adult beta-like globin genes in a primitive erythroid environment.Blood Cells Mol Dis. 1998 Sep;24(3):356-69. doi: 10.1006/bcmd.1998.0202. Blood Cells Mol Dis. 1998. PMID: 10087993
-
Activation of the delta-globin gene by the beta-globin gene CACCC motif.Blood Cells Mol Dis. 1999 Jun-Aug;25(3-4):193-209. doi: 10.1006/bcmd.1999.0245. Blood Cells Mol Dis. 1999. PMID: 10575545
-
Fetal globin gene repressors as drug targets for molecular therapies to treat the β-globinopathies.Mol Cell Biol. 2014 Oct 1;34(19):3560-9. doi: 10.1128/MCB.00714-14. Epub 2014 Jul 14. Mol Cell Biol. 2014. PMID: 25022757 Free PMC article. Review.
Cited by
-
Pharmacological Induction of Human Fetal Globin Gene in Hydroxyurea-Resistant Primary Adult Erythroid Cells.Mol Cell Biol. 2015 Jul;35(14):2541-53. doi: 10.1128/MCB.00035-15. Epub 2015 May 18. Mol Cell Biol. 2015. PMID: 25986606 Free PMC article.
-
Dictys: dynamic gene regulatory network dissects developmental continuum with single-cell multiomics.Nat Methods. 2023 Sep;20(9):1368-1378. doi: 10.1038/s41592-023-01971-3. Epub 2023 Aug 3. Nat Methods. 2023. PMID: 37537351
-
CtBP and associated LSD1 are required for transcriptional activation by NeuroD1 in gastrointestinal endocrine cells.Mol Cell Biol. 2014 Jun;34(12):2308-17. doi: 10.1128/MCB.01600-13. Epub 2014 Apr 14. Mol Cell Biol. 2014. PMID: 24732800 Free PMC article.
-
Functional footprinting of regulatory DNA.Nat Methods. 2015 Oct;12(10):927-30. doi: 10.1038/nmeth.3554. Epub 2015 Aug 31. Nat Methods. 2015. PMID: 26322838 Free PMC article.
-
Comparative genomics of neuroglobin reveals its early origins.PLoS One. 2012;7(10):e47972. doi: 10.1371/journal.pone.0047972. Epub 2012 Oct 25. PLoS One. 2012. PMID: 23133533 Free PMC article.
References
-
- Stamatoyannopoulos G., Grosveld F. (2001) in The Molecular Basis of Blood Diseases (Stamatoyannopoulos G., Majerus P., Perlmutter R., Varmus H. eds) 3rd Ed., W. B. Saunders, Philadelphia
-
- Tanimoto K., Engel J. D. (2000) Trends Cardiovasc. Med. 10, 15–19 - PubMed
-
- Palstra R. J., de Laat W., Grosveld F. (2008) Adv. Genet. 61, 107–142 - PubMed
-
- Higgs D. R., Vernimmen D., Wood B. (2008) Adv. Genet. 61, 143–173 - PubMed
-
- Orkin S. H. (1992) Blood 80, 575–581 - PubMed
Publication types
MeSH terms
Substances
LinkOut - more resources
Full Text Sources
Other Literature Sources
Molecular Biology Databases

