. 2010 Apr 9;285(15):11219-26.
doi: 10.1074/jbc.M109.042754. Epub 2010 Feb 4.

The microtubule-associated histone deacetylase 6 (HDAC6) regulates epidermal growth factor receptor (EGFR) endocytic trafficking and degradation

Affiliations

The microtubule-associated histone deacetylase 6 (HDAC6) regulates epidermal growth factor receptor (EGFR) endocytic trafficking and degradation

Ya-sheng Gao et al. J Biol Chem. .

Abstract

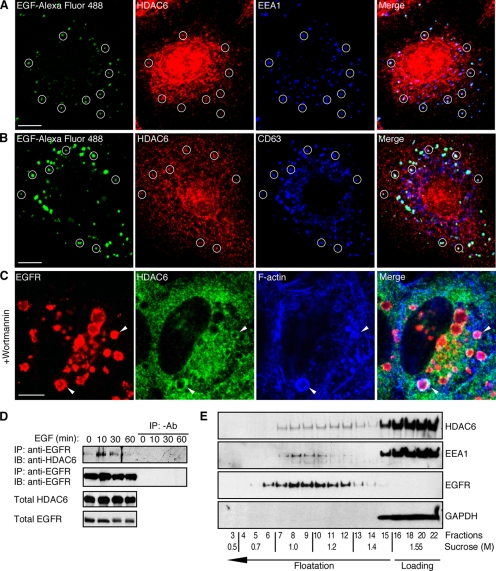
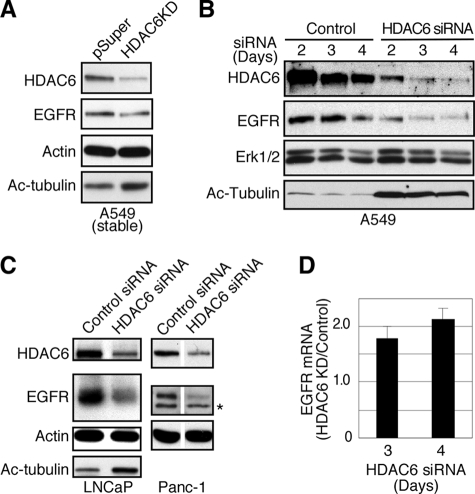
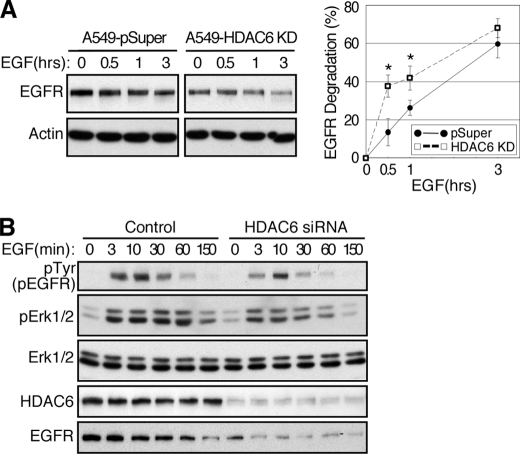
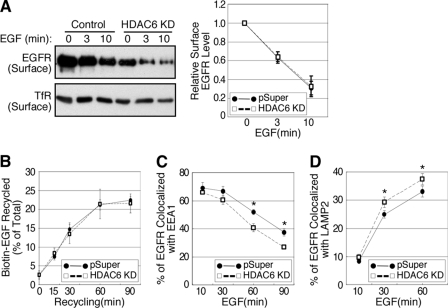
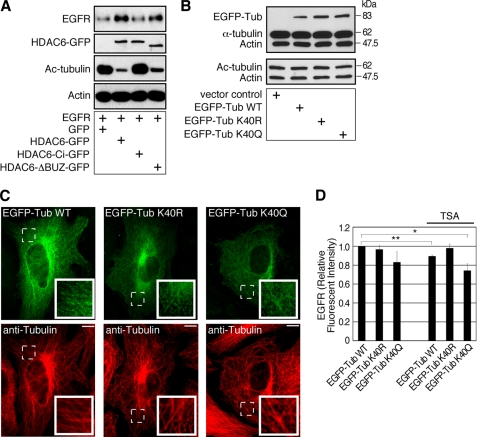
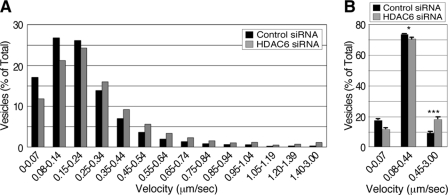
Histone deacetylase 6 (HDAC6) is a microtubule-associated deacetylase with tubulin deacetylase activity, and it binds dynein motors. Recent studies revealed that microtubule acetylation affects the affinity and processivity of microtubule motors. These unique properties implicate a role for HDAC6 in intracellular organelle transport. Here, we show that HDAC6 associates with the endosomal compartments and controls epidermal growth factor receptor (EGFR) trafficking and degradation. We found that loss of HDAC6 promoted EGFR degradation. Mechanistically, HDAC6 deficiency did not cause aberrant EGFR internalization and recycling. Rather, it resulted in accelerated segregation of EGFR from early endosomes and premature delivery of EGFR to the late endosomal and lysosomal compartments. The deregulated EGFR endocytic trafficking was accompanied by an increase in microtubule-dependent movement of EGFR-bearing vesicles, revealing a novel regulation of EGFR vesicular trafficking and degradation by the microtubule deacetylase HDAC6.


Figures

FIGURE 1.
FIGURE 1.
HDAC6 associates with the endosomal compartments. A, A549 cells were serum-starved overnight and treated with 80 ng/ml EGF-Alexa Fluor 488 for 10 min. Cells were then treated with 0.005% saponin before being processed for immunofluorescent microscopy using anti-EEA1 and HDAC6 antibodies. Cycles indicate examples of endosomes that display colocalization of EGF-Alexa Fluor 488 (green), EEA1 (blue), and HDAC6 (red). Scale bars throughout this figure: 10 μm. B, A549 cells were treated with EGF-Alexa Fluor 488 for 60 min and processed for immunostaining as in A using anti-CD63 and HDAC6 antibodies. Representative endosomes that show colocalization of EGF (green), CD63 (blue), and HDAC6 (green) were cycled. C, serum-starved A549 cells were pretreated with 100 nm wortmannin and were stimulated with EGF for 30 min. Triple-labeling immunofluorescent microscopy revealed association (arrowheads) between EGFR (red), HDAC6 (green), and F-actin (labeled with Phalloidin-Alexa Fluor 647, blue) at the enlarged late endosomes/MVBs. D, A549 cells were treated with EGF for indicated times and were processed for immunoprecipitation with monoclonal anti-EGFR antibody or without anti-EGFR antibody. Immunoblotting of the precipitates was carried out using anti-HDAC6 antibody or polyclonal anti-EGFR antibody. Total cell lysates were also examined for HDAC6 and EGFR. E, cell homogenate from A549 cells was loaded at the bottom of a discontinuous sucrose gradient and separated by equilibrium density centrifugation. Fractions from top of the tube were collected and analyzed by immunoblotting using anti-HDAC6, anti-EEA1, anti-EGFR, and anti-GAPDH antibodies. A portion of HDAC6 was up-floated in the gradient.
FIGURE 2.
FIGURE 2.
HDAC6 knock-down reduces EGFR stability. A, A549 cells with stable HDAC6 knock-down were examined by immunoblotting for EGFR, HDAC6, acetyl-tubulin, and β-actin. B, A549 cells were transfected with control siRNA or HDAC6-targeting siRNA for 2, 3, or 4 days. Cell lysates from both control and HDAC6 siRNA-treated cells were prepared and analyzed by immunoblotting using anti-HDAC6, anti-EGFR, anti-Erk1/2, and anti-acetyl α-tubulin antibodies. EGFR level was reduced in HDAC6 knock-down cells. C, LNCaP and Panc-1 cells were transfected with control siRNA or HDAC6-targeting siRNA for 3 days. Cell lysates from both control and HDAC6 knock-down cells were analyzed by immunoblotting using anti-HDAC6, anti-EGFR, anti-β-actin, and anti-acetyl α-tubulin antibodies. *, unidentified band. D, HDAC6 was transiently knocked down for 3 or 4 days as in B. EGFR transcripts were prepared and amplified by real-time PCR. EGFR mRNA from HDAC6 knock-down cells was compared with that from control cells. Average values from triplicate wells are shown.
FIGURE 3.
FIGURE 3.
EGFR degradation is promoted in HDAC6-deficient cells. A, control and stable HDAC6 knock-down A549 cells were serum-starved and stimulated with 100 ng/ml EGF in the presence of 10 μg/ml cycloheximide for indicated times. Cell lysates were examined for EGFR and β-actin by immunoblotting. A representative result was shown in the left panel. In the right panel, the densities of the EGFR bands were quantified using ImageJ software and normalized against β-actin. Results from five individual experiments were plotted to show that EGFR degradation was enhanced in HDAC6 knock-down cells. Error bar, S.E. *, p < 0.05 in two tailed Student's t test. B, control and HDAC6 siRNA-transfected (3 days) cells were serum-starved and stimulated with EGF for indicated times. Cell lysates were prepared and analyzed by immunoblotting using anti-phosphotyrosine, anti-phospho-Erk ½, anti-Erk ½, anti-EGFR, and anti-HDAC6 antibodies.
FIGURE 4.
FIGURE 4.
HDAC6 regulates post-endocytic transport. A, control and HDAC6 knock-down A549 cells were serum-starved overnight and were either left untreated or stimulated with 100 ng/ml EGF for 3 or 10 min. Cell surface proteins were biotin-labeled, pulled-down on avidin-beads, and analyzed by immunoblotting using anti-EGFR and anti-transferrin receptor antibodies (left panel). EGFR bands from four independent experiments were quantified and graphed (right panel). Error bars, S.E. B, A549 cells were serum-starved, processed to internalize biotin-EGF for 15 min, and chased for indicated times. Biotin-EGF reappeared in culture medium and on the cell surface, and was collected and quantified using a streptavidin-based colorimetric approach. Recycled biotin-EGF from five independent experiments was plotted. Error bar, S.E. C, A549 cells were serum-starved and stimulated with EGF for indicated periods of time. The cells were then processed for double labeling immunofluorescent microscopy using anti-EEA1 and anti-EGFR antibodies. Localization of EGFR to the EEA1-containing vesicles was analyzed using Image J software. *, p < 0.05 in two-tailed Student's t test, n = 3. Error bar, S.D. D, A549 cells were processed for double-labeling immunofluorescent microscopy as in C, except that anti-LAMP2 and anti-EGFR antibodies were used. Co-localization of EGFR to LAMP-2-containing vesicles was examined. *, p < 0.05 in two-tailed Student's t test, n = 5. Error bar, S.E.
FIGURE 5.
FIGURE 5.
Tubulin acetylation regulates EGFR in the cells. A, HDAC6 knock-out MEFs re-expressing control GFP, HDAC6-GFP, HDAC6-Ci-GFP, or HDAC6-ΔBUZ-GFP were engineered to express EGFR. Cell lysates were examined by immunoblotting using anti-EGFR, anti-GFP, anti-acetyl-tubulin, and anti-β-actin antibodies. The EGFR level was inversely correlated to tubulin acetylation. (GFP band in GFP control group was not shown.) B, 293T cells were transfected for 3 days with a control vector, EGFP-α-tubulin WT, EGFP-α-tubulin K40R, or EGFP-α-tubulin K40Q plasmid. Cell lysates were examined by immunoblotting using a mixture of anti-α-tubulin and anti-β-actin antibodies, or a mixture of anti-acetylated tubulin and anti-β-actin antibodies. C, MEFs were transfected with constructs as in B for 2.5 days, and the microtubules were visualized by immunofluorescence using an anti-tubulin antibody. The exogenous EGFP-tagged α-tubulin became a part of the microtubule network. Insets, enlarged areas marked by dotted lines. Bars, 10 μm. D, 293T cells were co-transfected with EGFR-pcDNA and EGFP-α-tubulin WT, EGFP-α-tubulin K40R, or EGFP-α-tubulin K40Q for 3 days. For the last 8 h of transfection, cells were treated with only cycloheximide or TSA and cycloheximide. Cells were immunostained for EGFR and examined by flow cytometry. **, p < 0.01 and *, p < 0.05 in two-tailed and paired Student's t test, n = 5. Error bars, S.E.
FIGURE 6.
FIGURE 6.
HDAC6-dependent tubulin deacetylation regulates post-endocytic vesicle transport. A, control and HDAC6 siRNA-treated (3 days) cells were serum-starved and treated with 80 ng/ml EGF-Alexa Fluor 488. The cells were then examined by video microscopy at a rate of 1 frame per second. Time-lapse image stacks were analyzed in MetaMorph, and the interval velocity of vesicle movement was recorded and pooled. The graph represents vesicle distribution against different velocity ranges. The high speed microtubule-dependent (0.45–3.00 μm/s) vesicle transport was enhanced in HDAC6 knock-down cells (gray bars) when compared to control cells (closed bars). B, vesicle mobility of control cells (closed bars) was compared with that of HDAC6 siRNA-treated cells (gray bars) in ranges of 0–0.07 μm/s, 0.08–0.44 μm/s (actin-dependent movement), and 0.45–3.00 μm/s. ***, p < 0.0001 and *, p < 0.05 in two-tailed Student's t test (n = 12).

References

    1. Yarden Y. (2001) Eur. J. Cancer 37, Suppl. 4, S3–S8 - PubMed
    1. Aniento F., Emans N., Griffiths G., Gruenberg J. (1993) J. Cell Biol. 123, 1373–1387 - PMC - PubMed
    1. Brown C. L., Maier K. C., Stauber T., Ginkel L. M., Wordeman L., Vernos I., Schroer T. A. (2005) Traffic 6, 1114–1124 - PubMed
    1. Loubéry S., Wilhelm C., Hurbain I., Neveu S., Louvard D., Coudrier E. (2008) Traffic 9, 492–509 - PubMed
    1. Lakadamyali M., Rust M. J., Babcock H. P., Zhuang X. (2003) Proc. Natl. Acad. Sci. U.S.A. 100, 9280–9285 - PMC - PubMed

Publication types