. 2010 Apr 2;285(14):10832-40.
doi: 10.1074/jbc.M109.091629. Epub 2010 Feb 4.

A conserved PMK-1/p38 MAPK is required in caenorhabditis elegans tissue-specific immune response to Yersinia pestis infection

Affiliations

A conserved PMK-1/p38 MAPK is required in caenorhabditis elegans tissue-specific immune response to Yersinia pestis infection

Devin D Bolz et al. J Biol Chem. .

Abstract

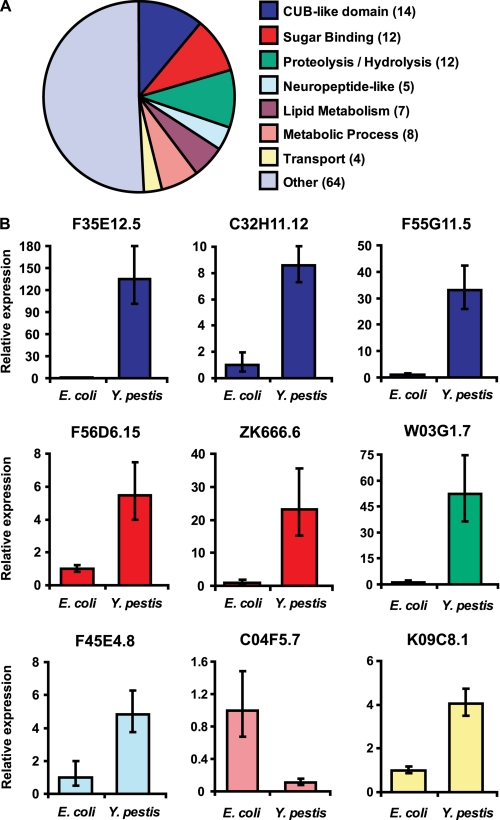
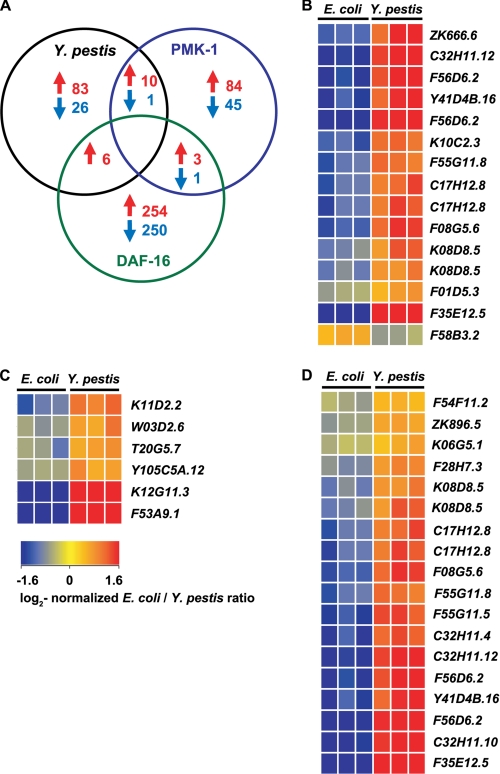
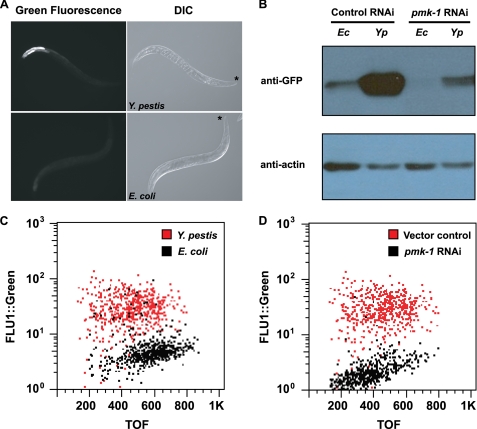
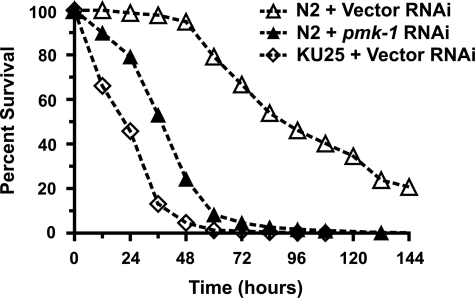
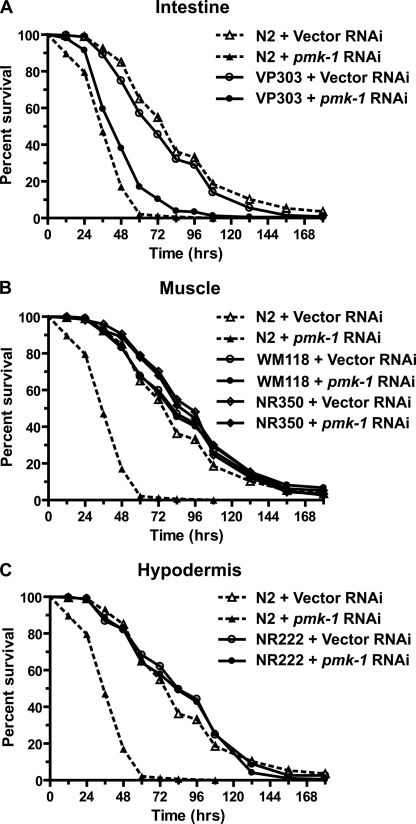
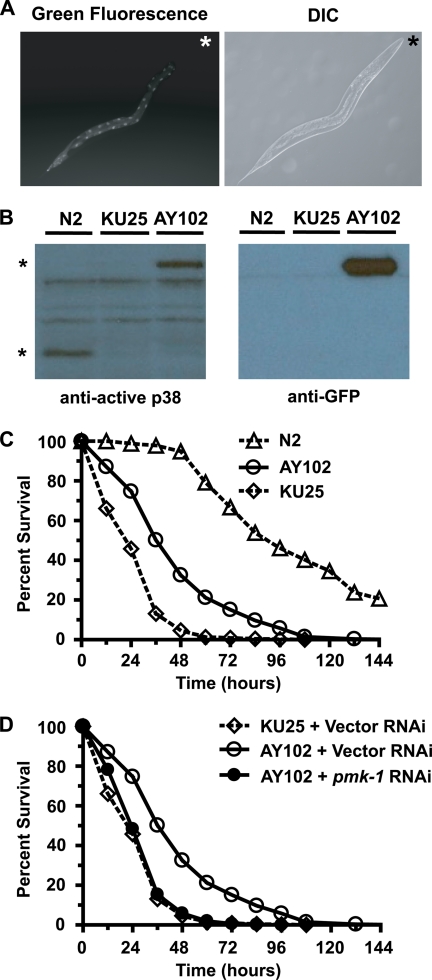
Yersinia pestis has acquired a variety of complex strategies that enable the bacterium to overcome defenses in different hosts and ensure its survival and successful transmission. A full-genome microarray analysis on Caenorhabditis elegans infected with Y. pestis shows enrichment in genes that are markers of innate immune responses and regulated by a conserved PMK-1/p38 MAPK. Consistent with a role in regulating expression of immune effectors, inhibition of PMK-1/p38 by mutation or RNA interference enhances susceptibility to Y. pestis. Further studies of mosaic animals where PMK-1/p38 is exclusively inhibited or overexpressed in a tissue-specific manner indicate that PMK-1/p38 controls expression of a CUB-like family of immune genes at the cell-autonomous level. Given the conserved nature of PMK-1/p38 MAPK-mediated signaling and innate immune responses, PMK-1/p38 MAPK may play a role in the immune response against Y. pestis in natural hosts.


Figures

FIGURE 1.
FIGURE 1.
C. elegans immune effectors are differentially regulated in response to Y. pestis infection. A, pie chart of genes families showing >2-fold change during Y. pestis infection. The number of genes for each family represented by the chart is indicated in parentheses. B, expression levels of F35E12.5, C32H11.12, F55G11.5, F56D6.15, ZK666.6, W03G1.7, F45E4.8, C04F5.7, and K09C8.1 were determined using real time PCR as described under “Materials and Methods.” Relative expression levels of the indicated genes were determined using the comparative CT method (14) with normalization to pan-actin (act-1, -3, -4) (15). Bar graphs correspond to expression levels relative to average expression following control treatment (E. coli). Error bars represent standard deviation among independent biological samples.
FIGURE 2.
FIGURE 2.
Genes induced in response to Y. pestis overlap with factors regulated by PMK-1 MAPK. A, Venn diagram illustrating the number of transcripts up-regulated and down-regulated by Y. pestis (p < 0.05, 2-fold) that were similarly influenced by PMK-1 (20) and DAF-16 (44). B–D, heat maps reflecting relative levels of gene expression during Y. pestis infection for clusters of PMK-1-regulated genes (20) (B), genes up-regulated by DAF-16 (44) (C), and genes down-regulated by DAF-16 (44)(D).
FIGURE 3.
FIGURE 3.
PMK-1 MAPK contributes to the induction of C. elegans genes in response to Y. pestis. A, AY101 acIs101[pDB09.1(pF35E12.5:: gfp);pRF4(rol-6(su1006))] animals containing a transcriptional reporter for F35E12.5 were exposed to Y. pestis (top panels) or E. coli (bottom panels) for 24 h and imaged using fluorescence microscopy. An asterisk indicates the head of the animals. DIC, differential interference contrast. B, Western blot analysis of GFP expression levels in AY101 animals. AY101 transgenic animals were treated with a control vector or pmk-1-specific RNAi. Total nematode lysates were collected from 50 adult animals following 24 h of exposure to E. coli (Ec) or Y. pestis (Yp). C and D, analysis of GFP fluorescence intensity in AY101 animals using the COPAS BIOSORT instrument (Union Biometrica, Holliston, MA) (45). C, AY101 animals treated with a control RNAi vector were exposed to Y. pestis or E. coli for 24 h. D, AY101 animals treated with control vector or pmk-1 RNAi were exposed to Y. pestis. GFP fluorescence intensity (FLU-1) was plotted against adult animal size, measured as time of flight (TOF). Each dot represents an individual nematode. All results are representative of three or more independent experiments.
FIGURE 4.
FIGURE 4.
PMK-1 MAPK is necessary for host defense against Y. pestis in the nematode C. elegans. Kaplan-Meier survival analysis of C. elegans strains challenged with Y. pestis KIM5. N2 wild-type animals were treated with either a control vector or pmk-1 RNAi. Strain KU25 contains the pmk-1(km25) deletion allele. Survival assays were performed as described under “Materials and Methods,” and animal survival was monitored every 12–24 h. Log rank analysis confirmed a significant decrease in survival following RNAi knockdown of pmk-1 (p < 0.0001) and a significant decrease in survival in strain KU25 (p < 0.0001) when compared with N2 animals.
FIGURE 5.
FIGURE 5.
Intestinal PMK-1 is required for survival on Y. pestis. Kaplan-Meier survival analysis of C. elegans strains challenged with Y. pestis KIM5 following RNAi knockdown of pmk-1 in the intestine (A), muscle (B), and hypodermis (C). Survival assays were performed as described under “Materials and Methods,” and animal survival was monitored every 12–24 h. Each plot represents the combined data of two or more experiments and a minimum of 90 animals (supplemental Table 2). Log rank analysis confirmed a significant decrease in survival following RNAi knockdown of pmk-1 in wild-type strain N2 (p < 0.0001) and strain VP303 (p < 0.0001) when compared with control RNAi treatment.
FIGURE 6.
FIGURE 6.
Expression of intestine-restricted PMK-1 enhances resistance to Y. pestis. A, AY102 transgenic animals expressing intestinal PMK-1::GFP were imaged using fluorescence microscopy. An asterisk indicates the head of the animal. B, Western blot analysis of total nematode lysates from wild-type (N2) animals, KU25 animals containing the pmk-1(km25) deletion allele, and AY102 animals. An asterisk indicates PMK-1 phosphoprotein (lower band) and PMK-1::GFP phosphoprotein (upper band). C and D, Kaplan-Meier survival analysis of N2, KU25 pmk-1(km25), and AY102 pmk-1(km25) acEx102[pDB09.2(pvha-6::pmk-1::gfp); pRF4(rol-6(su1006))] animals following treatment with a control vector (C) or comparison of control vector with pmk-1 RNAi (D). Each plot represents the combined data of four or more experiments and a minimum of 500 animals (supplemental Table 3). Log rank analysis confirmed a significant increase in resistance in strain AY102 (p < 0.0001), when compared with strain KU25. Additionally, knockdown of pmk-1 abolished the increased resistance in strain AY102 (p < 0.0001), relative to control treatment of AY102 animals.

References

    1. Achtman M., Zurth K., Morelli G., Torrea G., Guiyoule A., Carniel E. (1999) Proc. Natl. Acad. Sci. U.S.A. 96, 14043–14048 - PMC - PubMed
    1. Wren B. W. (2003) Nat. Rev. Microbiol. 1, 55–64 - PubMed
    1. Titball R. W., Hill J., Lawton D. G., Brown K. A. (2003) Biochem. Soc. Trans. 31, 104–107 - PubMed
    1. Marceau M. (2005) Curr. Issues Mol. Biol. 7, 151–177 - PubMed
    1. Pujol C., Bliska J. B. (2005) Clin. Immunol. 114, 216–226 - PubMed

Publication types

MeSH terms

Substances