. 2010 Mar;196(3):181-97.
doi: 10.1007/s00359-010-0503-y. Epub 2010 Feb 5.

Species-specific behavioral patterns correlate with differences in synaptic connections between homologous mechanosensory neurons

Affiliations

Species-specific behavioral patterns correlate with differences in synaptic connections between homologous mechanosensory neurons

Michael J Baltzley et al. J Comp Physiol A Neuroethol Sens Neural Behav Physiol. 2010 Mar.

Abstract

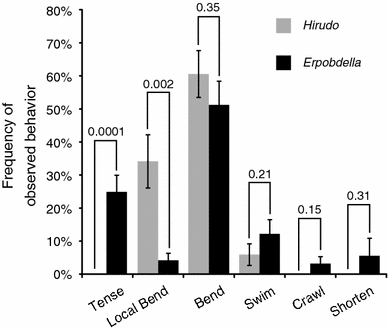
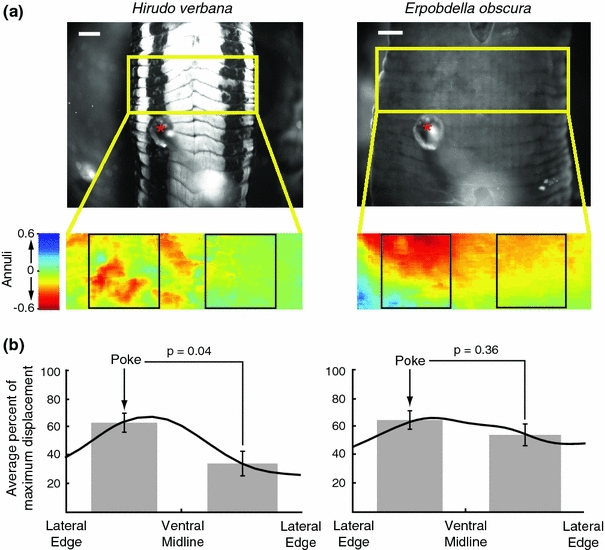
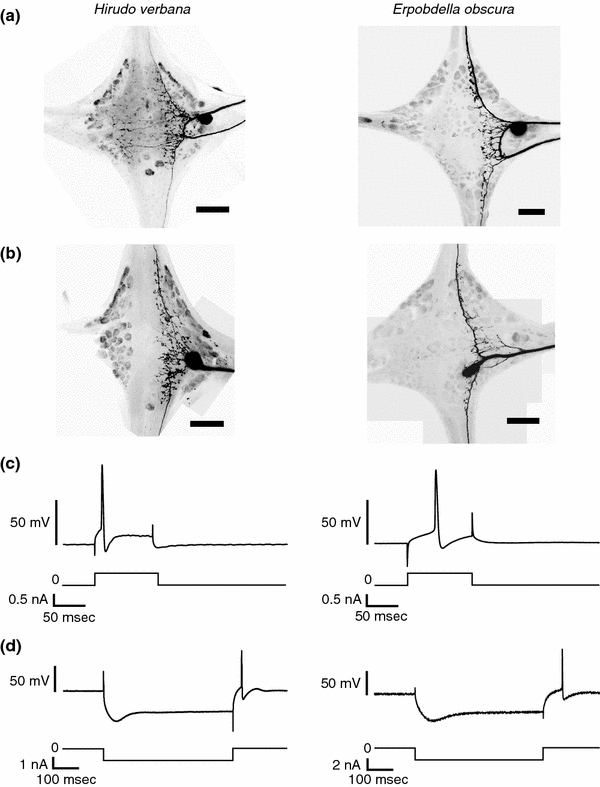
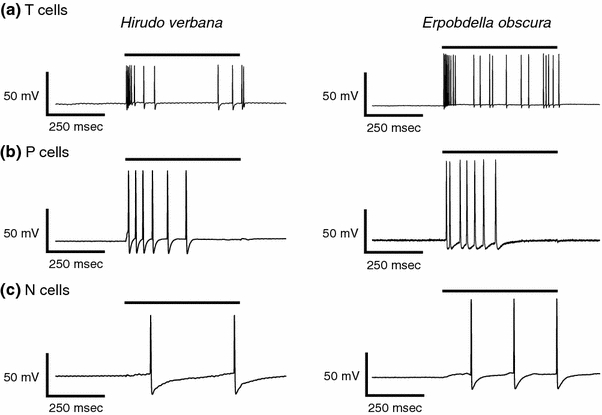
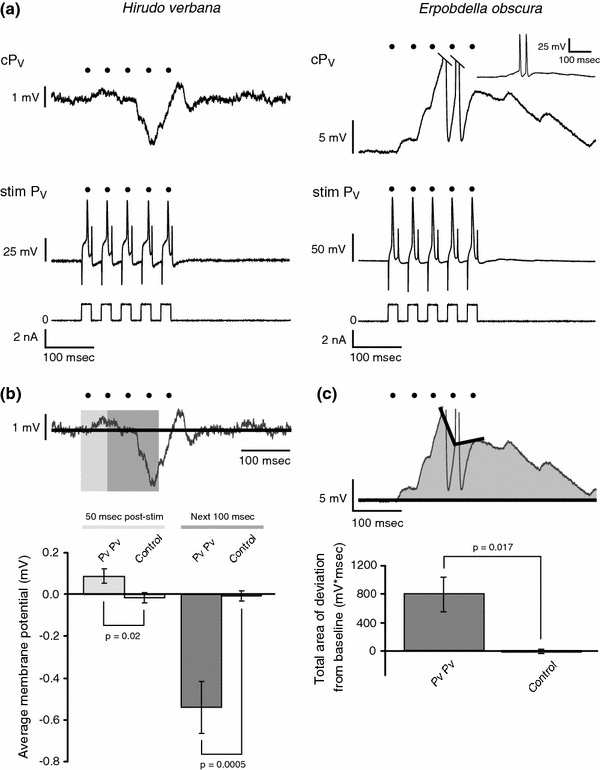
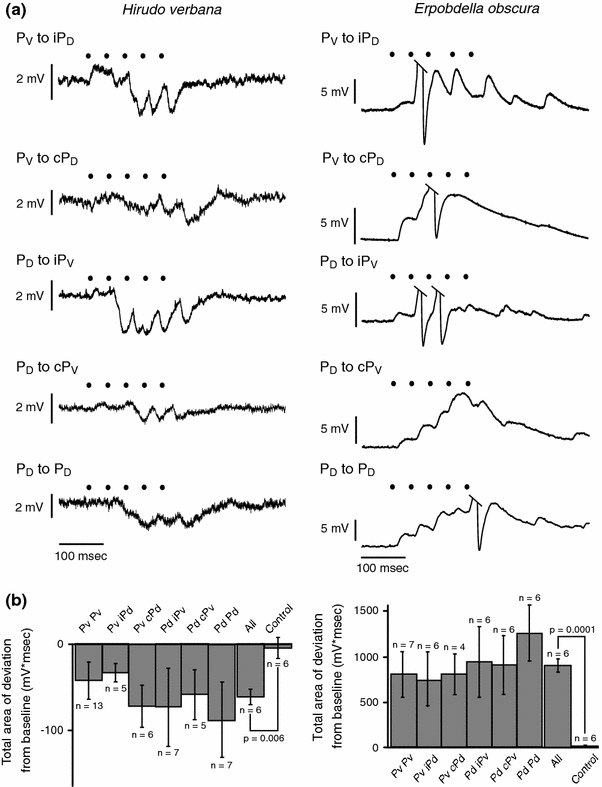
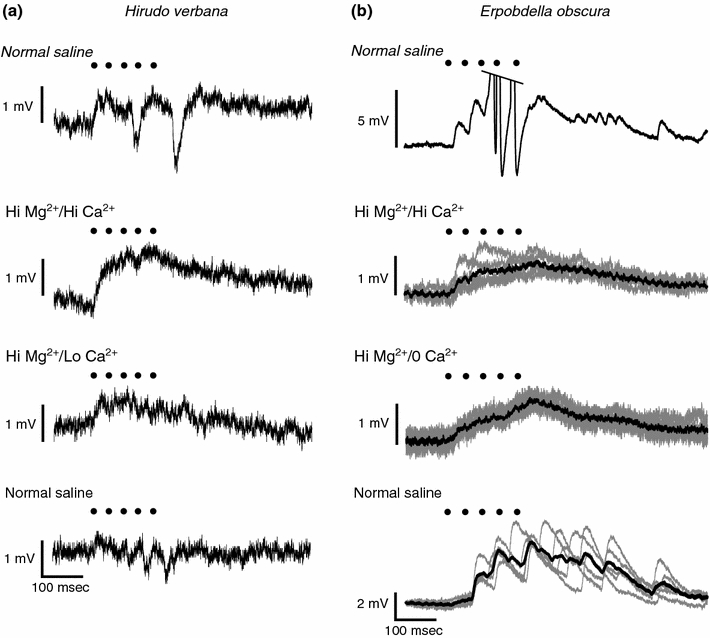
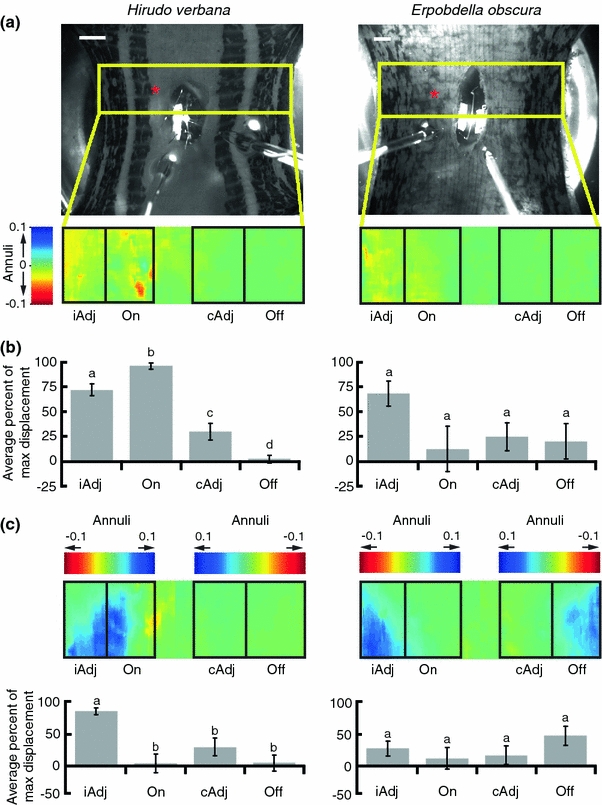
We characterized the behavioral responses of two leech species, Hirudo verbana and Erpobdella obscura, to mechanical skin stimulation and examined the interactions between the pressure mechanosensory neurons (P cells) that innervate the skin. To quantify behavioral responses, we stimulated both intact leeches and isolated body wall preparations from the two species. In response to mechanical stimulation, Hirudo showed local bending behavior, in which the body wall shortened only on the side of the stimulation. Erpobdella, in contrast, contracted both sides of the body in response to touch. To investigate the neuronal basis for this behavioral difference, we studied the interactions between P cells. Each midbody ganglion has four P cells; each cell innervates a different quadrant of the body wall. Consistent with local bending, activating any one P cell in Hirudo elicited polysynaptic inhibitory potentials in the other P cells. In contrast, the P cells in Erpobdella had excitatory polysynaptic connections, consistent with the segment-wide contraction observed in this species. In addition, activating individual P cells caused asymmetrical body wall contractions in Hirudo and symmetrical body wall contractions in Erpobdella. These results suggest that the different behavioral responses in Erpobdella and Hirudo are partly mediated by interactions among mechanosensory cells.


Figures

Fig. 1
Fig. 1
Behavioral responses to trains of weak electrical shocks that mimic light-to-moderate levels of touch in Hirudo verbana and Erpobdella obscura. Hirudo data are in light gray, Erpobdella are in dark gray. The error bars indicate SEM. The number above each pair of bars is the P value from the t test performed on the transformed data (see “Methods”). For Hirudo, n = 14; for Erpobdella, n = 15
Fig. 2
Fig. 2
Responses to skin stimulation in Hirudo and Erpobdella. We pinned five segments of body wall onto a Sylgard-coated syringe in a saline-filled chamber, ventral side up, with only the middle segment innervated by a ganglion. The circumferential lines mark annuli; a segment consists of five annuli. Scale bars 1 mm. a Top panels are video frames of Hirudo (left) and Erpobdella (right) before stimulation. The red asterisks mark the stimulus probe. The yellow box over the picture of the leech outlines the area of the body wall that was analyzed for motion. Bottom panels are motion analysis of the body wall after stimulation. The expanded colored rectangle indicates movements of the region between 0 and 1 s; cool colors (blue) indicate movement upward and warm colors (yellow–red) indicate movements downward. The black boxes on the expanded rectangle outline the contralateral and ipsilateral areas used to measure body wall movements. b Average magnitude of body wall movements of the black boxed area in Hirudo (left; n = 5) and Erpobdella (right; n = 5). The area analyzed was divided into 100 vertical columns. The black line is the smoothed mean percentage of maximum displacement for each of the 100 columns. The gray rectangles are the mean percentage of maximum displacement over the areas contained in the black boxes in a. The error bars indicate SEM
Fig. 3
Fig. 3
Comparison of P cells in Hirudo to the putative P cell homologs in Erpobdella. a Dye fills of a PV cell in Hirudo (left) and a putative PV homolog in Erpobdella (right). Scale bars represent 100 μm. These are typical morphologies of two PV cells in Hirudo and five putative PV homologs in Erpobdella. b Dye fills of a PD cell in Hirudo (left) and a putative PD homolog in Erpobdella (right). These are typical morphologies of two PD cells in Hirudo and three putative PD homologs in Erpobdella. Scale bars represent 100 μm. a, b Brightness and contrast were adjusted in Adobe Photoshop. c Representative traces showing the responses of a Hirudo P cell (left) and a putative Erpobdella P cell homolog (right) to a depolarizing current. Top traces are current clamp recordings from the P cells and the bottom traces show the magnitude and timing of depolarizing current. d Representative traces showing a sag current in a Hirudo P cell (left) and a putative Erpobdella P cell homolog (right) triggered by a prolonged hyperpolarization. Top traces are current clamp recordings from the P cells and the bottom traces show the magnitude and timing of hyperpolarizing current
Fig. 4
Fig. 4
Responses of T, P and N cells to mechanical stimulation of the body wall in Hirudo and Erpobdella. a Representative traces showing the response of a T cell in Hirudo (left) and Erpobdella (right) to a 500 ms stimulation of the body wall with a force of 100 mN/mm2. The black bar represents when the mechanical stimulus was applied. b Representative traces showing the response of a P cell in Hirudo (left) and Erpobdella (right) to a stimulation of the body wall with a force of 100 mN/mm2. c Representative traces showing the response of an N cell in Hirudo (left) and Erpobdella (right) to a stimulation of the body wall with a force of 100 mN/mm2
Fig. 5
Fig. 5
PV to PV connections in Hirudo and Erpobdella. a Representative response of a ventral P cell (P V) to stimulation of the other PV in a Hirudo (left) and Erpobdella (right) midbody ganglion. The bottom trace shows the stimulus protocol, the middle trace shows the action potentials produced in the stimulated PV (stim P V) by the depolarizing pulses, and the top trace shows the response of the contralateral, non-stimulated PV (cP V). In this trace, as well as in all other panels, black dots show the times of the peaks of the action potentials in the stimulated P cell. In Erpobdella, the tops of the action potentials were cropped in the top trace. The inset shows the complete response of the non-stimulated PV cell at a reduced amplification and a compressed time scale. Capacitance artifacts in the middle trace of Hirudo were partially deleted using Adobe Illustrator. b Average change in membrane potential relative to baseline in the non-stimulated PV in Hirudo. The trace is the same as the top trace in a. The solid black line indicates the mean baseline membrane potential. The light gray box is the first 50 ms of stimulation. The dark gray box is the next 100 ms. The bar graph shows the mean change in membrane potential from baseline over the first 50 ms after stimulation and over the subsequent 100 ms. The control bars are the mean change in membrane potential in the non-stimulated PV over 50 ms and the next 100 ms beginning 2 s after the end of the stimulus bursts. The error bars indicate SEM; n = 13. c Quantification of the depolarization observed in the non-stimulated PV in Erpobdella. The trace is the same as the top trace in a. The mean pre-stimulus membrane potential is represented by the black line. The area of the deviation from the baseline membrane potential is shaded in gray. The bar graph shows the mean shaded area in the non-stimulated PV in the 500 ms following the first current pulse in the stimulated cell. The action potentials were not included in our calculation of deviation from baseline (see “Methods”). The control bar is the mean shaded area in the non-stimulated PV over 500 ms beginning 2 s after the end of the stimulus bursts. The error bars indicate SEM; n = 7. P V ventral P cell, stim stimulated, c contralateral
Fig. 6
Fig. 6
P to P connections in Hirudo and Erpobdella midbody ganglia. a Representative traces of the response of a postsynaptic P cell to the stimulation of another P cell in Hirudo (left) and Erpobdella (right). Black dots in both a and b represent the peak of the action potentials in the stimulated P cell. The label subscripts (D dorsal, V ventral) indicate which kind of P cell was stimulated and recorded. The small letters before the recipient P cell indicate whether that P cell was ipsilateral (i) or contralateral (c) to the stimulated P cell. Taken together with the PV to PV recordings shown in Fig. 4, these recordings represent all possible combinations of the four P cells taken two at a time. b Deviation from baseline of the postsynaptic P cell for all P cell pairs in Hirudo (left) and Erpobdella (right). ‘All’ is the mean area of deviation from baseline for all six pairs of P to P interactions. ‘Control’ is the mean area of deviation from baseline for the control periods for all six pairs of P to P interactions. The error bars indicate SEM. Within a species, none of the means for the P to P interactions are significantly different from one another (Hirudo: P = 0.847; Erpobdella: P = 0.881). Each mean for the P to P interactions in Erpobdella is significantly different from its complementary mean in Hirudo (see “Results”). i ipsilateral, c contralateral, P V ventral P cell, P D dorsal P cell
Fig. 7
Fig. 7
Synaptic connectivity between P cells in Hirudo and Erpobdella. a Recordings of a PV in Hirudo while stimulating the ipsilateral PD. The top trace is in normal leech saline. The next trace is in a 10 mM Mg2+/10 mM Ca2+ saline. The third trace is in a 10 mM Mg2+/1 mM Ca2+ saline. The bottom trace is a washout in normal saline. Black dots in both a and b represent the peak of the action potentials in the stimulated P cell. b Recordings of a PV in Erpobdella while stimulating the contralateral PV. The top trace is in normal leech saline. The next trace is in a 10 mM Mg2+/10 mM Ca2+ saline. The third trace is in a 20 mM Mg2+/0 mM Ca2+ saline. The bottom trace is a washout in normal saline. For the bottom three traces, five sweeps of raw data were overlapped (gray lines) along with their average (black line). P V ventral P cell, P D dorsal P cell
Fig. 8
Fig. 8
Body wall movement due to intracellular stimulation of a P cell. a Top panels are video frames of Hirudo (left) and Erpobdella (right) before stimulation. The yellow box over the picture of the leech outlines the area of the body wall that was analyzed for motion. The red asterisks mark the middle of the receptive field of the stimulated P cell. The expanded colored rectangle indicates longitudinal movements of the region between 0 and 1 s; cool colors (blue) indicate movement upward and warm colors (yellow–red) indicate movements downward. The black boxes on the expanded rectangle outline the regions used to compare body wall movements. ‘On’ is the body wall region corresponding to the receptive field of the stimulated P cell. ‘iAdj’, ‘cAdj’, and ‘Off’ are, respectively, the ipsilateral adjacent, contralateral adjacent, and contralateral non-adjacent body wall regions relative to the stimulated P cell. In these examples, the right PV in Hirudo and the left PV in Erpobdella were stimulated. The images for Erpobdella were reflected along the vertical axis to aid in comparing the two species. Scale bars 1 mm. b Average magnitude of longitudinal body wall movement in Hirudo (left; n = 11) and Erpobdella (right; n = 10). The gray bars are the mean percentage of maximum displacement over the areas contained in the black boxes in a. The letter above each bar indicates significant differences between regions. The error bars indicate SEM. c The colored rectangle indicates lateral movements of the body wall between 0 and 1 s; cool colors (blue) indicate movement toward the ventral midline and warm colors (yellow–red) indicate movements toward the dorsal midline. The black boxes on the expanded rectangle outline the regions used to compare body wall movements. The bottom panels are the average magnitude of lateral body wall movement in Hirudo (left; n = 11) and Erpobdella (right; n = 10). The gray bars are the mean percentage of maximum displacement over the areas contained in the black boxes in the top panel. The letter above each bar indicates significant differences between regions. The error bars indicate SEM. On receptive field of the stimulated P cell, iAdj receptive field of the ipsilateral and adjacent P cell, cAdj receptive field of the contralateral and adjacent P cell, Off receptive field of the non-adjacent P cell

Similar articles

Cited by

References

    1. Antonsen BL, Herberholz J, Edwards DH. The retrograde spread of synaptic potentials and recruitment of presynaptic inputs. J Neurosci. 2005;25:3086–3094. doi: 10.1523/JNEUROSCI.4433-04.2005. - DOI - PMC - PubMed
    1. Baca SM, Thomson EE, Kristan WB., Jr Location and intensity discrimination in the leech local bend response quantified using optic flow and principal components analysis. J Neurophysiol. 2005;93:3560–3572. doi: 10.1152/jn.01263.2004. - DOI - PubMed
    1. Baca SM, Marin-Burgin A, Wagenaar DA, Kristan WB., Jr Widespread inhibition proportional to excitation controls the gain of a leech behavioral circuit. Neuron. 2008;57:276–289. doi: 10.1016/j.neuron.2007.11.028. - DOI - PMC - PubMed
    1. Baltzley MJ, Lohmann KJ. Comparative study of TPep-like immunoreactive neurons in the central nervous system of nudibranch molluscs. Brain Behav Evol. 2008;72:192–206. doi: 10.1159/000157356. - DOI - PubMed
    1. Baylor DA, Nicholls JG. Chemical and electrical synaptic connexions between cutaneous mechanoreceptor neurones in central nervous system of leech. J Physiol (Lond) 1969;203:591–609. - PMC - PubMed

Publication types