. 2010 Apr;28(2):305-21.
doi: 10.1007/s10827-009-0210-2. Epub 2010 Feb 6.

Synchrony with shunting inhibition in a feedforward inhibitory network

Affiliations

Synchrony with shunting inhibition in a feedforward inhibitory network

Sachin S Talathi et al. J Comput Neurosci. 2010 Apr.

Abstract

Recent experiments have shown that GABA(A) receptor mediated inhibition in adult hippocampus is shunting rather than hyperpolarizing. Simulation studies of realistic interneuron networks with strong shunting inhibition have been demonstrated to exhibit robust gamma band (20-80 Hz) synchrony in the presence of heterogeneity in the intrinsic firing rates of individual neurons in the network. In order to begin to understand how shunting can contribute to network synchrony in the presence of heterogeneity, we develop a general theoretical framework using spike time response curves (STRC's) to study patterns of synchrony in a simple network of two unidirectionally coupled interneurons (UCI network) interacting through a shunting synapse in the presence of heterogeneity. We derive an approximate discrete map to analyze the dynamics of synchronous states in the UCI network by taking into account the nonlinear contributions of the higher order STRC terms. We show how the approximate discrete map can be used to successfully predict the domain of synchronous 1:1 phase locked state in the UCI network. The discrete map also allows us to determine the conditions under which the two interneurons can exhibit in-phase synchrony. We conclude by demonstrating how the information from the study of the discrete map for the dynamics of the UCI network can give us valuable insight into the degree of synchrony in a larger feed-forward network of heterogeneous interneurons.


Figures

Fig. 1
Fig. 1
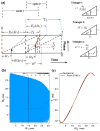
(a) Schematic diagram for STRC calculations. The neuron firing with intrinsic period T0 = 31 ms receives a single synaptic perturbation at time δt. as a result subsequent firing cycles are affected. Depending on the type of synapse and the synaptic kinetics, the effect of perturbation can persist for multiple firing cycles, resulting in Tj(δt) ≠ T0 (j = 1,2,3…). Inset to Fig. 1(a) (below the schematic diagram) we show the actual time series for membrane potential of a neuron receiving a single synaptic perturbation through a shunting synapse (ER = −55 mV) and hyperpolarizing synapse (ER = −75 mV) respectively. We see that the shunting synapse shortens the effective period of the firing cycle in which the perturbation is received, such that there is still significant non-zero synaptic contribution (the red trace showing S(t)) which affects the subsequent firing cycle. However for hyperpolarizing synapse, the perturbation prolongs the length of first cycle such that synaptic contribution is essentially zero in the following cycle. (b) First order STRC Φ1 is color coded as function of the reversal potential of the inhibitory synapse and the perturbation time. (c) Second order STRC Φ2 is color coded as function of the reversal potential of the inhibitory synapse and the perturbation time. (d) The third order STRC Φ3 is color coded as function of the reversal potential of the inhibitory synapse and the perturbation time. Inset of Fig. 1(b–d) show the STRC's calculated for two specific cases corresponding to a hyperpolarizing synapse (ER = −75 mV, shown in black) and a shunting synapse (ER = −55 mV, shown in green). The synaptic parameters are gs = 0.15 mS/cm2, τR = 0.1 ms, τD = 8 ms. The resting potential of the neuron is Vrest = −65 mV (IDC = 0) and the threshold to spiking is VT ≈ −55mV
Fig. 2
Fig. 2
(a) Schematic diagram of the re-normalization and the re-scaling procedure to determine the length of second cycle T2(δt1, δt2) (adapted from Talathi et al. (2009)). Red dashed lines represents the effective spike times after the neuron receives two consecutive synaptic perturbations. Black dotted lines represent the change in the firing cycle caused by synaptic input in the first firing cycle. Shown in black dashed line is the unperturbed firing cycle for the neuron. To the right (inset to Fig. 2(a)) we shown three distinct triangles that can be extracted from Fig. 2(a), which are used to determine the re-normalized effective synaptic perturbation time δte and the re-scaled amplitude of the phase of synaptic perturbation αe (b) The percent error δE2 between the numerically estimated value T2N and the analytically estimated value T2P through Eq. (4) for the second cycle T2(δt1, δt2) is color coded as function of the synaptic perturbation times δt1 and δt2. (c) The numerically estimated period T2N (shown in black) and the analytically estimated period T2P for a given value of first perturbation time δt1 = 15 ms is plotted as function of the second synaptic perturbation time. The synaptic parameters are gs = 0.15 mS/cm2, τR = 0.1 ms, τD = 8 ms and ER = −55 mV. The intrinsic period T0 = 31 ms
Fig. 3
Fig. 3
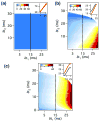
(a) Color coded percent error δE2 between the numerically estimated period T2N and the analytically determined period T2P through Eq. (5) for a neuron receiving two consecutive synaptic inputs through a hyperpolarizing synapse with parameters ER = −80 mV, gs = 0.15 mS/cm2, τR = 0.1 ms, and τD = 8 ms. (b) Color coded percent error δE2 determine through Eq. (5) for the neuron receiving two synaptic inputs through a shunting synapse with synaptic parameters gs = 0.15 mS/cm2, τR =0.1 ms, τD = 8 ms and ER = −55 mV. (c) Color coded percent error δE2 determine through Eq. (6) for the neuron receiving two synaptic inputs through a shunting synapse with synaptic parameters gs = 0.15 mS/cm2, τR = 0.1 ms, τD = 8 ms and ER = −55 mV.) The inset in each of the Fig. 3(a–c) shows the plot of T2(δt1, δt2) as a function of second perturbation time δt2 for a fixed value for the time of first synaptic perturbation at δt1 = 15 ms. Numerical estimate is shown in black and the analytically determined period is shown in red
Fig. 4
Fig. 4
(a) Color coded percent error δẼ3 between the predicted value E3P and the numerically estimated value E3N for the length of third cycle 3 in the presence of two consecutive synaptic inputs at times δt1 and δt2 respectively. The inset shows the variation in 3 ( E3N shown in black and E3P) shown in red) as a function of δt2 for δt1 = 15 ms. (b) Color coded percent error δE3 between the predicted value T3P and the numerically estimated value T3N for the length of third cycle T3 in the presence of three consecutive synaptic inputs at times δt1, δt2 and δt3 = 5 ms respectively. The inset shows the variation in T3(δt1, δt2, δt3) ( T3N shown in black and T3P) shown in red) as a function of δt2 for δt1 = 15 ms and δt3 = 15 ms. The synaptic parameters are gs = 0.15 mS/cm2, τR = 0.1 ms, τD = 8 ms and ER = −55 mV
Fig. 5
Fig. 5
(a) Schematic diagram of the unidirectionally coupled pair of interneurons A and B. Also shown is the variation in the intrinsic firing frequency of the neuron as function of percent heterogeneity H, defined as H=100IDC0.50.5 where IDC is the input current to the neuron. (b) Schematic diagram of spike times for neurons A and B, when they are phase locked in 1:1 synchrony. (c) Arnold tongue representing the domain for 1:1 synchrony in the UCI network in the two-dimensional gsH plane, is shown in black (determined through stable fixed point solutions to Eq. (9)) and shown in blue (computed through numerical simulations). The synaptic parameters are τR = 0.1 ms, τD = 8 ms and ER = −55 mV, representing a slow shunting synapse. (d) Arnold tongue for the UCI network interacting through a fast shunting synapse with synaptic parameters τR = 0.1 ms, τD = 2 ms and ER = −55 mV
Fig. 6
Fig. 6
(a) Arnold tongue for the UCI network with slow shunting synapse. (b) Arnold tongue for the UCI network with fast shunting synapse. The red dotted circles in a-b represent points that satisfy Eq. (11) corresponding to fixed point solution δ* = 0 for the discrete map in Eq. (9). (c) The red circles represent values for the function S in Eq. (12), calculated at points that represent the solution to Eq. (11) for the UCI network with fast shunting synapse
Fig. 7
Fig. 7
The time lag δn between spike times of the two neurons in the UCI network coupled through a fast shunting synapse (a) without synaptic delay and (b) with synaptic delay τs = 12 ms. The small dotted circles correspond to the situation when the two neurons are not phase locked in 1:1 synchrony representing the state of asynchronous oscillations between the two neurons. The black bold circles correspond to the value of δn obtained numerically in the region within the Arnold tongue when the two neurons are phase locked in 1:1 synchrony. The red circles represent the solution to Eq. (10) corresponding to the stable fixed point's of the discrete map in Eq. (9)
Fig. 8
Fig. 8
(a) Feed-forward network of three heterogeneously firing interneurons coupled through a slow shunting synapse in absence of any synaptic delay. (b) Feed-forward network of three heterogeneously firing interneurons coupled through a slow shunting synapse with synaptic delay τsij(i,j=0,1,2). The membrane potential of neuron 0,1 and 2 is shown in colors black, red and green respectively. The mean membrane potential is shown in blue trace. The constant input current values are IDC0=0.9113 μA/cm2, IDC1=0.675 μA/cm2, IDC2=0.5 μA/cm2. The synaptic delay determined from the fixed point solution to the discrete map in Eq. (11) are τs01=12.16 ms and τs02=1.98 ms. The synaptic parameters are: gs = 0.15 mS/cm2, τR = 0.1 ms, τD = 8 ms and ER = −55 mV

References

    1. Abarbanel H, Gibb L, Huerta R, Rabinovich M. Biophysical model of synaptic plasticity dynamics. Biological Cybernetics. 2003;89:214–226. - PubMed
    1. Acker C, Kopell N, White J. Synchronization of strongly coupled excitatory neurons:relating network behavior to biophysics. Journal of Computational Neuroscience. 2004;15:71–90. - PubMed
    1. Aoki F. Increased gamma-range activity in human sensorimotor cortex during performance of visuomotor tasks. Clinical Neurophysiology. 1999;110:524–537. - PubMed
    1. Bartos M, Vida I, Frotscher M, Meyer A, Monyer H, Geiger J, et al. Fast synaptic inhibition promotes synchronized gamma oscillations in hippocampal interneuron networks. Proceedings of the National Academy of Sciences. 2002;99:13,222–13,227. - PMC - PubMed
    1. Bartos M, Vida I, Jonas P. Synaptic mechanisms of synchronized gamma oscillations in inhibitory interneuron networks. Nature Reviews Neuroscience. 2007;8:45–56. - PubMed

Publication types

MeSH terms

LinkOut - more resources