

Validation of a fluid-structure interaction model of solute transport in pores of cyclically deformed tissue scaffolds
- PMID: 20136371
- PMCID: PMC2943692
- DOI: 10.1089/ten.TEC.2009.0685
Validation of a fluid-structure interaction model of solute transport in pores of cyclically deformed tissue scaffolds
Abstract
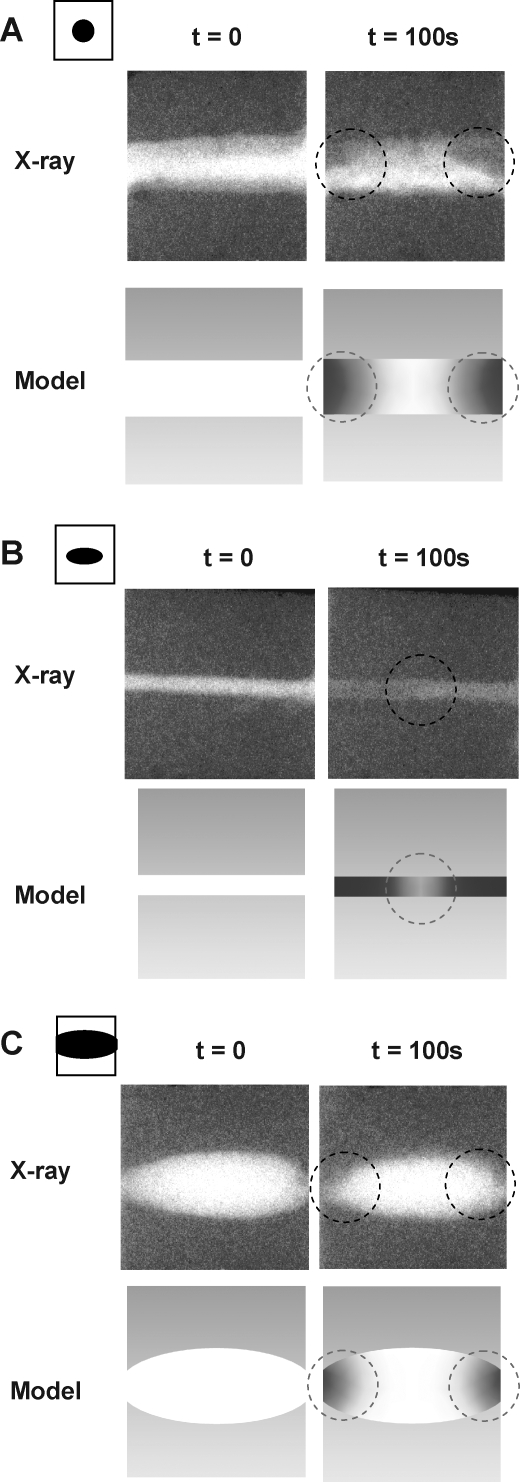
Convection induced by repetitive compression of porous tissue scaffolds enhances solute transport inside the scaffold. Our previous experiments have shown that pore size, shape, and orientation with respect to strain direction greatly influence loading-induced solute transport. The objective of this study was to develop a computational model of deformation-induced solute transport in porous tissue scaffolds, which included the pore geometry of the scaffold. This geometry consisted of a cubic scaffold with single channel in the middle of the scaffold, immersed in a fluid reservoir. Cylindrical pores with circular or elliptic cross section, and spheroid pores were modeled. The scaffold was cyclically compressed from one side, causing fluid motion and dispersion of solute inside the scaffold pore. Scaffold deformation was solved using the finite element method, and fluid flow and solute transport were solved using the finite volume method. The distortion of the scaffold-fluid interface was transferred as a boundary condition to the fluid flow solver. Both convection and diffusion were included in the computations. The solute transport rates in the different scaffold pore geometries agreed well with our previous experimental results obtained with X-ray microimaging. This model will be used to explore transport properties of a spectrum of novel scaffold designs.
Figures


Similar articles
-
Solute transport in cyclically deformed porous tissue scaffolds with controlled pore cross-sectional geometries.Tissue Eng Part A. 2009 Aug;15(8):1989-99. doi: 10.1089/ten.tea.2008.0382. Tissue Eng Part A. 2009. PMID: 19196145 Free PMC article.
-
Cyclic deformation-induced solute transport in tissue scaffolds with computer designed, interconnected, pore networks: experiments and simulations.Ann Biomed Eng. 2009 Aug;37(8):1601-12. doi: 10.1007/s10439-009-9712-3. Epub 2009 May 23. Ann Biomed Eng. 2009. PMID: 19466547 Free PMC article.
-
A Mechanobiology-based Algorithm to Optimize the Microstructure Geometry of Bone Tissue Scaffolds.Int J Biol Sci. 2016 Jan 1;12(1):1-17. doi: 10.7150/ijbs.13158. eCollection 2016. Int J Biol Sci. 2016. PMID: 26722213 Free PMC article.
-
Transport of macromolecules across microvascular walls: the two-pore theory.Physiol Rev. 1994 Jan;74(1):163-219. doi: 10.1152/physrev.1994.74.1.163. Physiol Rev. 1994. PMID: 8295933 Review.
-
A survey of methods for the evaluation of tissue engineering scaffold permeability.Ann Biomed Eng. 2013 Oct;41(10):2027-41. doi: 10.1007/s10439-013-0815-5. Epub 2013 Apr 24. Ann Biomed Eng. 2013. PMID: 23612914 Review.
References
-
- Brown D.A. MacLellan W.R. Laks H. Dunn J.C. Wu B.M. Beygui R.E. Analysis of oxygen transport in a diffusion-limited model of engineered heart tissue. Biotechnol Bioeng. 2007;97:962. - PubMed
-
- Volkmer E. Drosse I. Otto S. Stangelmayer A. Stengele M. Kallukalam B.C. Mutschler W. Schieker M. Hypoxia in static and dynamic 3D culture systems for tissue engineering of bone. Tissue Eng Part A. 2008;14:1331. - PubMed
-
- Karande T.S. Ong J.L. Agrawal C.M. Diffusion in musculoskeletal tissue engineering scaffolds: design issues related to porosity, permeability, architecture, and nutrient mixing. Ann Biomed Eng. 2004;32:1728. - PubMed
-
- Ramrattan N.N. Heijkants R.G. van Tienen T.G. Schouten A.J. Veth R.P. Buma P. Assessment of tissue ingrowth rates in polyurethane scaffolds for tissue engineering. Tissue Eng. 2005;11:1212. - PubMed
Publication types
MeSH terms
Grants and funding
LinkOut - more resources
Full Text Sources
