. 2010 Jul;16(7):2183-96.
doi: 10.1089/ten.TEA.2009.0717.

Characterization of ex vivo-generated bovine and human cartilage by immunohistochemical, biochemical, and magnetic resonance imaging analyses

Affiliations

Characterization of ex vivo-generated bovine and human cartilage by immunohistochemical, biochemical, and magnetic resonance imaging analyses

Ashleigh E Nugent et al. Tissue Eng Part A. 2010 Jul.

Abstract

Osteoarthritis (OA) is a prevalent age-associated disease involving altered chondrocyte homeostasis and cartilage degeneration. The avascular nature of cartilage and the altered chondrocyte phenotype characteristic of OA severely limit the capacity for in vivo tissue regeneration. Cell- and tissue-based repair has the potential to revolutionize treatment of OA, but those approaches have exhibited limited clinical success to date. In this study, we test the hypothesis that bovine and human chondrocytes in a collagen type I scaffold will form hyaline cartilage ex vivo with immunohistochemical, biochemical, and magnetic resonance (MR) endpoints similar to the original native cartilage. Chondrocytes were isolated from 1- to 3-week-old calf knee cartilage or from cartilage obtained from human total knee arthroplasties, suspended in 2.7 mg/mL collagen I, and plated as 300 microL spot cultures with 5 x 10(6) each. Medium formulations were varied, including the amount of serum, the presence or absence of ascorbate, and treatments with cytokines. Bovine chondrocytes generated metachromatic territorial and interstitial matrix and accumulated type II collagen over time. Type VI collagen was confined primarily to the pericellular region. The ex vivo-formed bovine cartilage contained more chondroitin sulfate per dry weight than native cartilage. Human chondrocytes remained viable and generated metachromatic territorial matrix, but were unable to support interstitial matrix accumulation. MR analysis of ex vivo-formed bovine cartilage revealed evidence of progressively maturing matrix, but MR-derived indices of tissue quality did not reach those of native cartilage. We conclude that the collagen-spot culture model supports formation and maturation of three-dimensional hyaline cartilage from active bovine chondrocytes. Future studies will focus on determining the capacity of human chondrocytes to show comparable tissue formation.


Figures

FIG. 1.
FIG. 1.
Histological characterization of native bovine and human cartilage. Sections were stained with thionin to estimate proteoglycan distribution via metachromasia, and reacted with antibodies against collagen II, collagen VI, and collagen I. In both bovine and human cartilage, metachromasia increased with depth from the articular surface. Collagen II was found in both the territorial (arrowheads) and interstitial matrix (arrows). As expected, collagen VI was localized in the pericellular regions within human articular cartilage (arrowheads). Collagen VI was found in both the pericellular (arrowheads) and interstitial (arrows) zones in native bovine cartilage. Collagen I was localized to a small band in the superficial zone in both samples (arrows). Asterisk indicates articular surface. Color images available online at www.liebertonline.com/ten.
FIG. 2.
FIG. 2.
Histological characterization of bovine SCs grown in Opti-MEM medium with ascorbate. Histological sections were analyzed with thionin, along with antibodies against collagen II, collagen VI, and collagen I. There was increased extension of proteoglycan and collagen II into the interstitial matrix with time in culture. Collagen VI reached maximal staining at 2–3 days in culture, and retained its pericellular localization. Collagen I staining diminished after ∼5 days in culture, and was nearly undetectable at 6 weeks. d, day; wk, week; SCs, spot cultures. Color images available online at www.liebertonline.com/ten.
FIG. 3.
FIG. 3.
Efficacy of various medium formulations to induce matrix synthesis from human SCs. (A, E) Ham's F-12+2% FBS+50 μg/mL Asc; (B, F) Ham's F-12+10% FBS; (C, G) Ham's F-12+10% FBS+50 μg/mL Asc; (D, H) Opti-MEM+50 μg/mL Asc; time points as indicated. Thionin staining (A–D) illustrates little metachromasia outside small regions of territorial matrix. Immunostaining for collagen II (E–H) also displays little matrix staining, though minimal territorial matrix staining appears in the (F) and (G) groups. Asc, ascorbate; FBS, fetal bovine serum; wk, week. Color images available online at www.liebertonline.com/ten.
FIG. 4.
FIG. 4.
(A) Biochemically determined sulfated glycosaminoglycan (sGAG) content of bovine SCs grown in Opti-MEM medium with or without 50 μg/mL ascorbate. sGAG content of native bovine cartilage is also presented for comparison. SCs grown without ascorbate reached similar levels of sGAG content to native bovine cartilage after 4 weeks in culture. SCs grown with ascorbate reached similar levels of sGAG content to native bovine cartilage after 2 weeks in culture, and exceeded native cartilage after 4 weeks (*p < 0.05). d, day; wk, week. (B) Biochemically determined hydroxyproline (HP) content of bovine SCs grown in Opti-MEM medium with or without 50 μg/mL ascorbate. Results for native bovine cartilage are also presented for comparison. Numerical results reflect both the underlying collagen I gel scaffold and the collagen elaborated by neocartilage, but can, nevertheless, be compared between the two groups presented. Ascorbate-treated SCs accumulated significantly higher HP content at the indicated time points (*p < 0.05); however, HP values did not reach those of the native tissue. d, day; wk, week.
FIG. 5.
FIG. 5.
(A) Magnetic resonance analysis of native bovine (n = 12) and human (n = 7) cartilage. T2 is inversely correlated with overall macromolecular content; both bovine and human samples show a decrease in T2 with distance from the articular surface. Magnetization transfer rate (MTR) and km correlate primarily with the collagen content of the matrix; both bovine and human samples show increasing values with depth. (B) Magnetic resonance analysis of ascorbate-treated bovine SCs (n = 5). SCs show a decrease in T2 with increased time in culture, reflecting progressive deposition of matrix, but values remained significantly lower than those in native cartilage. SCs show an increase in km and MTR with time in culture, but values did not reach those seen in native bovine cartilage. Asterisks indicate statistical significance (p < 0.05).
FIG. 5.
FIG. 5.
(A) Magnetic resonance analysis of native bovine (n = 12) and human (n = 7) cartilage. T2 is inversely correlated with overall macromolecular content; both bovine and human samples show a decrease in T2 with distance from the articular surface. Magnetization transfer rate (MTR) and km correlate primarily with the collagen content of the matrix; both bovine and human samples show increasing values with depth. (B) Magnetic resonance analysis of ascorbate-treated bovine SCs (n = 5). SCs show a decrease in T2 with increased time in culture, reflecting progressive deposition of matrix, but values remained significantly lower than those in native cartilage. SCs show an increase in km and MTR with time in culture, but values did not reach those seen in native bovine cartilage. Asterisks indicate statistical significance (p < 0.05).
FIG. 6.
FIG. 6.
(A) Magnetic-resonance-determined fixed charge density (FCD) of native bovine and human cartilage. FCD is a negative quantity, since the matrix-fixed charges are negative. An increase in the magnitude of FCD reflects increasing sGAG deposition. The magnitude of FCD increases with depth from the articular surface in both native bovine (n = 12) and human cartilage (n = 7). (B) FCD of ascorbate-treated bovine SCs (n = 5). The magnitude of FCD increases through 4 weeks in culture, with a decline seen 6 weeks. The FCD never reaches the level seen in the explant tissue. Asterisks indicate statistical significance (p < 0.05).
FIG. 7.
FIG. 7.
Thionin staining and collagen II immunohistochemistry of control (Opti-MEM medium with ascorbate) and cytokine-treated (Opti-MEM medium with ascorbate, interleukin-1β, and tumor necrosis factor-α as indicated in Materials and Methods section) SCs. (A, B) Control SCs grown for 4 weeks; (E, F) control SCs grown for 6 weeks, without the addition of cytokines. SCs sacrificed immediately after 1 week of cytokine treatment (C, D), while SCs exposed to cytokines for 1 week and then grown in the absence of cytokines for a further 2 week recovery period (G, H); see text for experimental details. Extracellular matrix depletion resulting from the cytokine treatment is evident in all treated samples (C, D, G, H). Even after 2 weeks of recovery, bovine chondrocytes in SCs are unable to re-initiate extracellular matrix neosynthesis (G, H). Color images available online at www.liebertonline.com/ten.
FIG. 8.
FIG. 8.
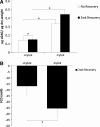
(A) Biochemical determination of sGAG content of cytokine-treated SCs (control and cytokine treatments as specified in Fig. 7). Both cytokine-treated groups (No Recovery and 2wk Recovery, labeled +Cytok) showed significantly decreased sGAG content as compared with control SCs grown in the absence of cytokines (labeled −Cytok, *p < 0.05). Even after 2 weeks of control growth postcytokine treatment, there is no quantifiable increase in sGAG content compared with SCs sacrificed immediately after cytokine treatment (^p = 0.58). (B) Magnetic-resonance-determined FCD in SCs as assessed after 2 weeks of recovery following 1 week of cytokine exposure (2wk Recovery), and values for corresponding control SCs (6 weeks of control growth, n = 5). See text for full experimental details. As seen, there was a persistent deficit in FCD in the cytokine-exposed SCs.

Similar articles

Cited by

References

    1. Chen C.T. Fishbein K.W. Torzilli P.A. Hilger A. Spencer R.G. Horton W.E., Jr. Matrix fixed-charge density as determined by magnetic resonance microscopy of bioreactor-derived hyaline cartilage correlates with biochemical and biomechanical properties. Arthritis Rheum. 2003;48:1047. - PubMed
    1. Shulz R.M. Bader A. Cartilage tissue engineering and bioreactor systems for the cultivation and stimulation of chondrocytes. Eur Biophys J. 2007;36:539. - PubMed
    1. Almqvist K.F. Dhollander A.A. Verdonk P.C. Forsyth R. Verdonk R. Verbruggen G. Treatment of cartilage defects in the knee using alginate beads containing human mature allogenic chondrocytes. Am J Sports Med. 2009;37:1920. - PubMed
    1. Chajra H. Rousseau C.F. Cortial D. Ronzière M.C. Herbage D. Mallein-Gerin F. Freyria A.M. Collagen-based biomaterials and cartilage engineering. Application to osteochondral defects. Biomed Mater Eng. 2008;18:S33. - PubMed
    1. Mohan N. Nair P. A synthetic scaffold favouring chondrogenic phenotype over a natural scaffold. Tissue Eng Part A. 2010;16:373. - PubMed

Publication types

LinkOut - more resources