

Mitochondria-targeted antioxidant effects of S(-) and R(+) pramipexole
- PMID: 20137065
- PMCID: PMC2829550
- DOI: 10.1186/1471-2210-10-2
Mitochondria-targeted antioxidant effects of S(-) and R(+) pramipexole
Abstract
Background: Pramipexole exists as two isomers. The S(-) enantiomer is a potent D3/D2 receptor agonist and is extensively used in the management of PD. In contrast, the R(+) enantiomer is virtually devoid of any of the DA agonist effects. Very limited studies are available to characterize the pharmacological spectrum of the R(+) enantiomer of pramipexole.
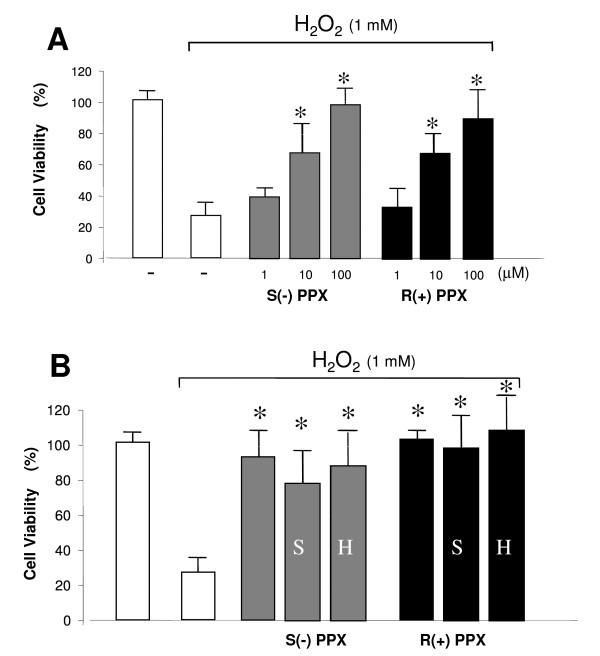
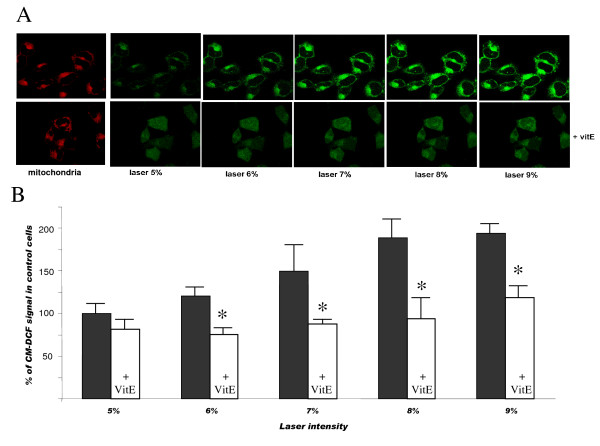
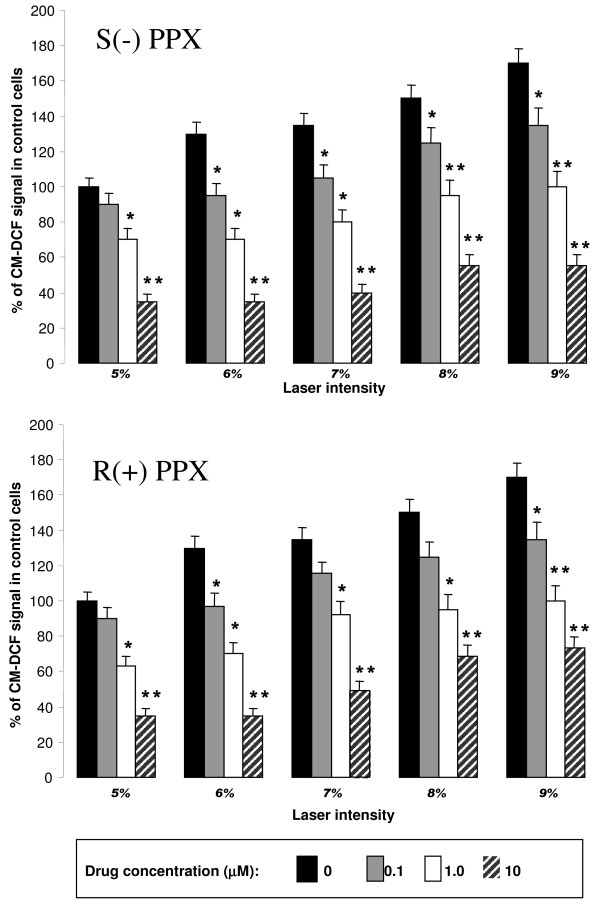
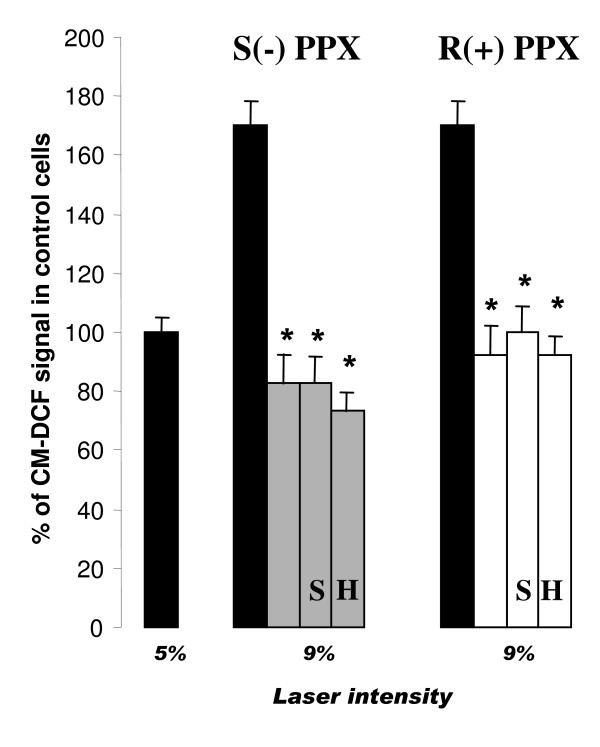
Results: Using differentiated SH-SY5Y neuroblastoma cells as an experimental model, here we show that S(-) and R(+) pramipexole are endowed with equipotent efficacy in preventing cell death induced by H2O2 and inhibiting mitochondrial reactive oxygen species generation. Both pramipexole enantiomers prevented mitochondrial ROS generation with a potency about ten times higher then that elicited for neuroprotection.
Conclusions: These results support the concept of both S(-) and R(+) pramipexole enantiomers as mitochondria-targeted antioxidants and suggest that the antioxidant, neuroprotective activity of these drugs is independent of both the chiral 6-propylamino group in the pramipexole molecule and the DA receptor stimulation.
Figures
Similar articles
-
Targeted antioxidative and neuroprotective properties of the dopamine agonist pramipexole and its nondopaminergic enantiomer SND919CL2x [(+)2-amino-4,5,6,7-tetrahydro-6-Lpropylamino-benzathiazole dihydrochloride].J Pharmacol Exp Ther. 2006 Jan;316(1):189-99. doi: 10.1124/jpet.105.092312. Epub 2005 Sep 27. J Pharmacol Exp Ther. 2006. PMID: 16188953
-
Pramipexole protects against H2O2-induced PC12 cell death.Naunyn Schmiedebergs Arch Pharmacol. 2006 Jan;372(4):257-66. doi: 10.1007/s00210-005-0025-2. Epub 2005 Dec 16. Naunyn Schmiedebergs Arch Pharmacol. 2006. PMID: 16362428
-
Antioxidant property of pramipexole independent of dopamine receptor activation in neuroprotection.J Neural Transm (Vienna). 2000;107(10):1165-73. doi: 10.1007/s007020070030. J Neural Transm (Vienna). 2000. PMID: 11129106
-
Mitochondria-targeted peptide antioxidants: novel neuroprotective agents.AAPS J. 2006 Aug 18;8(3):E521-31. doi: 10.1208/aapsj080362. AAPS J. 2006. PMID: 17025271 Free PMC article. Review.
-
KNS-760704 [(6R)-4,5,6,7-tetrahydro-N6-propyl-2, 6-benzothiazole-diamine dihydrochloride monohydrate] for the treatment of amyotrophic lateral sclerosis.CNS Neurosci Ther. 2008 Fall;14(3):215-26. doi: 10.1111/j.1755-5949.2008.00048.x. CNS Neurosci Ther. 2008. PMID: 18801114 Free PMC article. Review.
Cited by
-
Neuroprotective effects of pre-treatment with l-carnitine and acetyl-L-carnitine on ischemic injury in vivo and in vitro.Int J Mol Sci. 2012;13(2):2078-2090. doi: 10.3390/ijms13022078. Epub 2012 Feb 15. Int J Mol Sci. 2012. PMID: 22408439 Free PMC article.
-
Dexpramipexole is ineffective in two models of ALS related neurodegeneration.PLoS One. 2014 Dec 19;9(12):e91608. doi: 10.1371/journal.pone.0091608. eCollection 2014. PLoS One. 2014. PMID: 25526593 Free PMC article.
-
Dopamine D2 receptor-mediated neuroprotection in a G2019S Lrrk2 genetic model of Parkinson's disease.Cell Death Dis. 2018 Feb 12;9(2):204. doi: 10.1038/s41419-017-0221-2. Cell Death Dis. 2018. PMID: 29434188 Free PMC article.
-
New Therapeutics to Modulate Mitochondrial Function in Neurodegenerative Disorders.Curr Pharm Des. 2017;23(5):731-752. doi: 10.2174/1381612822666161230144517. Curr Pharm Des. 2017. PMID: 28034353 Free PMC article. Review.
-
Amyotrophic lateral sclerosis and the clinical potential of dexpramipexole.Ther Clin Risk Manag. 2012;8:359-66. doi: 10.2147/TCRM.S21981. Epub 2012 Aug 27. Ther Clin Risk Manag. 2012. PMID: 22956874 Free PMC article.
References
-
- Schapira AH. Neuroprotection in PD - a role for dopamine agonists? Neurology. 2003;61:S34–S42. - PubMed
Publication types
MeSH terms
Substances
LinkOut - more resources
Full Text Sources
Medical
