

Bayesian mapping of pulmonary tuberculosis in Antananarivo, Madagascar
- PMID: 20137083
- PMCID: PMC2829568
- DOI: 10.1186/1471-2334-10-21
Bayesian mapping of pulmonary tuberculosis in Antananarivo, Madagascar
Abstract
Background: Tuberculosis (TB), an infectious disease caused by the Mycobacterium tuberculosis is endemic in Madagascar. The capital, Antananarivo is the most seriously affected area. TB had a non-random spatial distribution in this setting, with clustering in the poorer areas. The aim of this study was to explore this pattern further by a Bayesian approach, and to measure the associations between the spatial variation of TB risk and national control program indicators for all neighbourhoods.
Methods: Combination of a Bayesian approach and a generalized linear mixed model (GLMM) was developed to produce smooth risk maps of TB and to model relationships between TB new cases and national TB control program indicators. The TB new cases were collected from records of the 16 Tuberculosis Diagnostic and Treatment Centres (DTC) of the city from 2004 to 2006. And five TB indicators were considered in the analysis: number of cases undergoing retreatment, number of patients with treatment failure and those suffering relapse after the completion of treatment, number of households with more than one case, number of patients lost to follow-up, and proximity to a DTC.
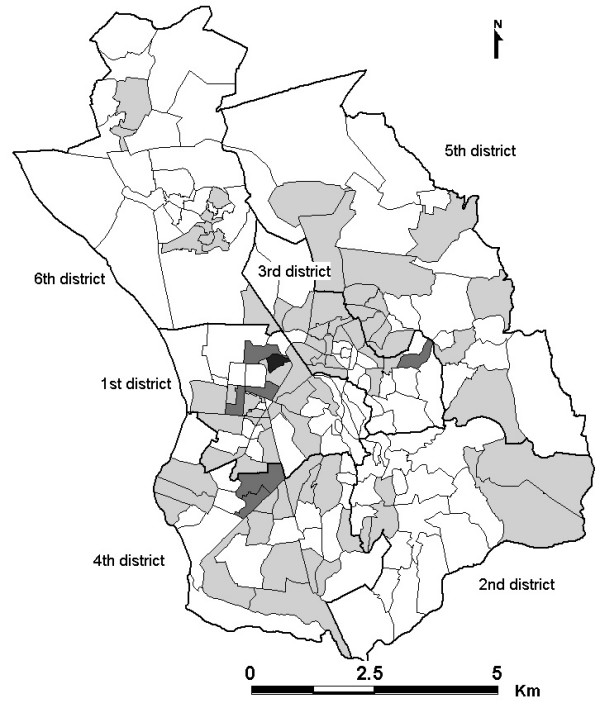
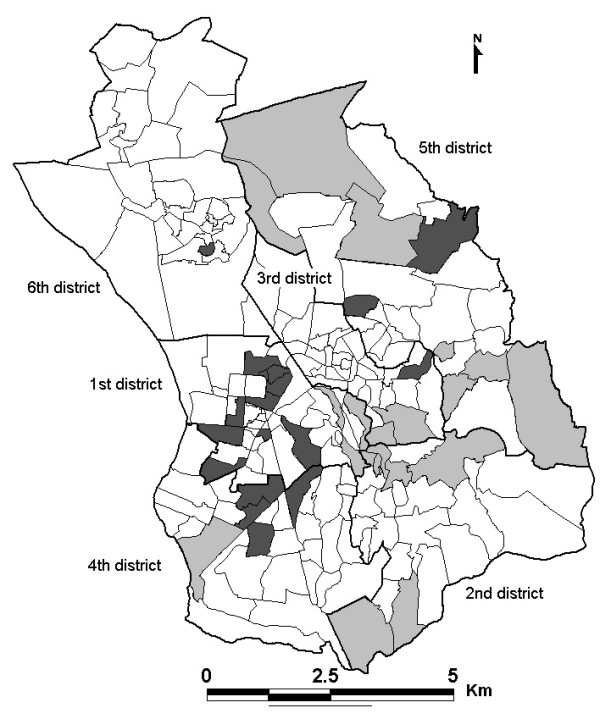
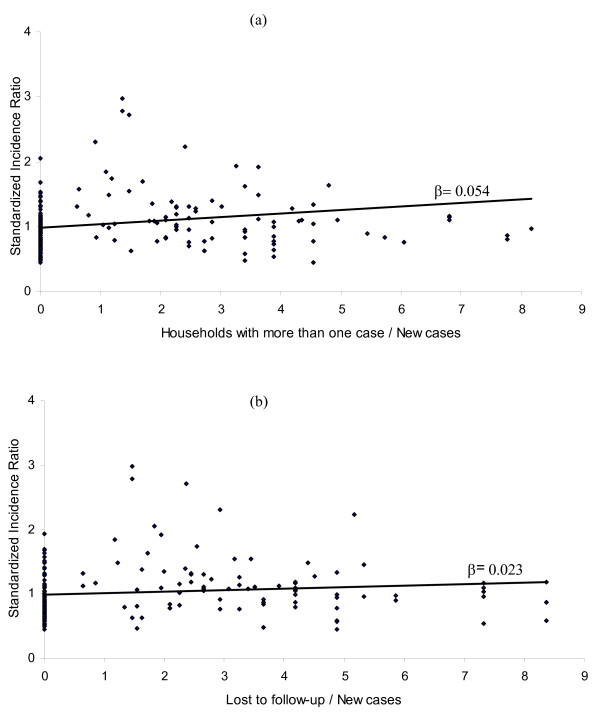
Results: In Antananarivo, 43.23% of the neighbourhoods had a standardized incidence ratio (SIR) above 1, of which 19.28% with a TB risk significantly higher than the average. Identified high TB risk areas were clustered and the distribution of TB was found to be associated mainly with the number of patients lost to follow-up (SIR: 1.10, CI 95%: 1.02-1.19) and the number of households with more than one case (SIR: 1.13, CI 95%: 1.03-1.24).
Conclusion: The spatial pattern of TB in Antananarivo and the contribution of national control program indicators to this pattern highlight the importance of the data recorded in the TB registry and the use of spatial approaches for assessing the epidemiological situation for TB. Including these variables into the model increases the reproducibility, as these data are already available for individual DTCs. These findings may also be useful for guiding decisions related to disease control strategies.
Figures
Similar articles
-
Assessment of tuberculosis spatial hotspot areas in Antananarivo, Madagascar, by combining spatial analysis and genotyping.BMC Infect Dis. 2017 Aug 14;17(1):562. doi: 10.1186/s12879-017-2653-9. BMC Infect Dis. 2017. PMID: 28806916 Free PMC article.
-
Spatial clustering of pulmonary tuberculosis and impact of the care factors in Antananarivo City.Trop Med Int Health. 2009 Apr;14(4):429-37. doi: 10.1111/j.1365-3156.2009.02239.x. Epub 2009 Feb 17. Trop Med Int Health. 2009. PMID: 19228353
-
Spatial analysis of pulmonary tuberculosis in Antananarivo Madagascar: tuberculosis-related knowledge, attitude and practice.PLoS One. 2014 Nov 11;9(11):e110471. doi: 10.1371/journal.pone.0110471. eCollection 2014. PLoS One. 2014. PMID: 25386655 Free PMC article.
-
An Overview on Epidemiology of Tuberculosis.Mymensingh Med J. 2019 Jan;28(1):259-266. Mymensingh Med J. 2019. PMID: 30755580 Review.
-
Multidrug-resistant tuberculosis surveillance and cascade of care in Madagascar: a five-year (2012-2017) retrospective study.BMC Med. 2020 Jun 30;18(1):173. doi: 10.1186/s12916-020-01626-6. BMC Med. 2020. PMID: 32600414 Free PMC article. Review.
Cited by
-
Co-endemicity of Pulmonary Tuberculosis and Intestinal Helminth Infection in the People's Republic of China.PLoS Negl Trop Dis. 2016 Apr 18;10(3):e0004580. doi: 10.1371/journal.pntd.0004580. eCollection 2016 Mar. PLoS Negl Trop Dis. 2016. PMID: 27088504 Free PMC article.
-
Methods used in the spatial analysis of tuberculosis epidemiology: a systematic review.BMC Med. 2018 Oct 18;16(1):193. doi: 10.1186/s12916-018-1178-4. BMC Med. 2018. PMID: 30333043 Free PMC article.
-
Mapping HIV epidemics in sub-Saharan Africa with use of GPS data.Lancet Glob Health. 2013 Nov;1(5):e251-3. doi: 10.1016/S2214-109X(13)70084-6. Epub 2013 Oct 24. Lancet Glob Health. 2013. PMID: 25104487 Free PMC article. No abstract available.
-
Identification of High and Low-Risk Areas of Tuberculosis in Lorestan Province, West of Iran.Tanaffos. 2017 Jun;16(4):270-276. Tanaffos. 2017. PMID: 29849683 Free PMC article.
-
A novel Bayesian geospatial method for estimating tuberculosis incidence reveals many missed TB cases in Ethiopia.BMC Infect Dis. 2017 Oct 2;17(1):662. doi: 10.1186/s12879-017-2759-0. BMC Infect Dis. 2017. PMID: 28969585 Free PMC article.
References
-
- Murray CJL, Lopez AD. The global burden of disease: a comprehensive assessment of mortality and disability from diseases, injuries and risk factors in 1990 and projected to 2020: summary. WHO document, Geneva, Switzerland. 1996. W 74 96GL-1/1996.
-
- Auregan G, Rakotondramarina D, Razafinimanana J, Ramarokoto H, Ratsirahonana O, Ralamboson M. Programme national de lutte anti-tuberculeuse (PNLAT) à Madagascar. Arch Inst Pasteur Madagascar. 1995;62:4–12. - PubMed
-
- Ministère de la Santé et du Planning Familial, Madagascar. Données statistiques 2004. Rapport du Ministère de la Santé et du Planning familial de Madagascar. 2006.
Publication types
MeSH terms
LinkOut - more resources
Full Text Sources
