

Hypoglycemia induced changes in cholinergic receptor expression in the cerebellum of diabetic rats
- PMID: 20137086
- PMCID: PMC2845573
- DOI: 10.1186/1423-0127-17-7
Hypoglycemia induced changes in cholinergic receptor expression in the cerebellum of diabetic rats
Abstract
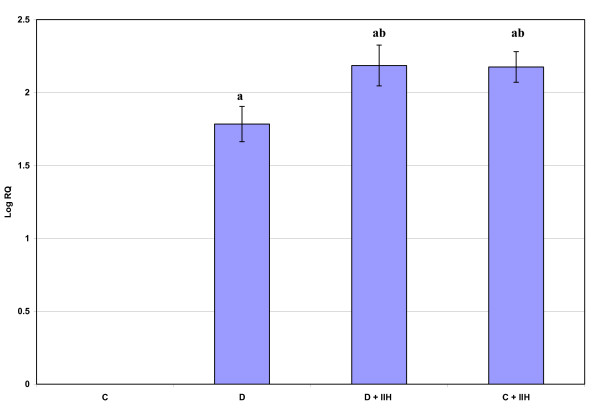
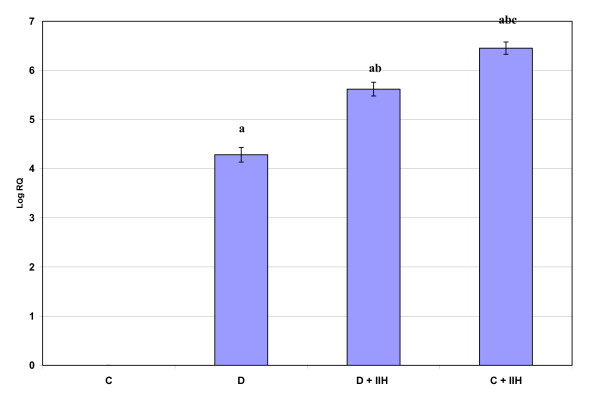
Glucose homeostasis in humans is an important factor for the functioning of nervous system. Hypoglycemia and hyperglycemia is found to be associated with central and peripheral nerve system dysfunction. Changes in acetylcholine receptors have been implicated in the pathophysiology of many major diseases of the central nervous system (CNS). In the present study we showed the effects of insulin induced hypoglycemia and streptozotocin induced diabetes on the cerebellar cholinergic receptors, GLUT3 and muscle cholinergic activity. Results showed enhanced binding parameters and gene expression of Muscarinic M1, M3 receptor subtypes in cerebellum of diabetic (D) and hypoglycemic group (D + IIH and C + IIH). alpha7nAchR gene expression showed a significant upregulation in diabetic group and showed further upregulated expression in both D + IIH and C + IIH group. AchE expression significantly upregulated in hypoglycemic and diabetic group. ChAT showed downregulation and GLUT3 expression showed a significant upregulation in D + IIH and C + IIH and diabetic group. AchE activity enhanced in the muscle of hypoglycemic and diabetic rats. Our studies demonstrated a functional disturbance in the neuronal glucose transporter GLUT3 in the cerebellum during insulin induced hypoglycemia in diabetic rats. Altered expression of muscarinic M1, M3 and alpha7nAchR and increased muscle AchE activity in hypoglycemic rats in cerebellum is suggested to cause cognitive and motor dysfunction. Hypoglycemia induced changes in ChAT and AchE gene expression is suggested to cause impaired acetycholine metabolism in the cerebellum. Cerebellar dysfunction is associated with seizure generation, motor deficits and memory impairment. The results shows that cerebellar cholinergic neurotransmission is impaired during hyperglycemia and hypoglycemia and the hypoglycemia is causing more prominent imbalance in cholinergic neurotransmission which is suggested to be a cause of cerebellar dysfunction associated with hypoglycemia.
Figures


Similar articles
-
Cholinergic and GABAergic receptor functional deficit in the hippocampus of insulin-induced hypoglycemic and streptozotocin-induced diabetic rats.Neuroscience. 2012 Jan 27;202:69-76. doi: 10.1016/j.neuroscience.2011.11.058. Epub 2011 Dec 3. Neuroscience. 2012. PMID: 22155651
-
The effects of abnormalities of glucose homeostasis on the expression and binding of muscarinic receptors in cerebral cortex of rats.Eur J Pharmacol. 2011 Jan 25;651(1-3):128-36. doi: 10.1016/j.ejphar.2010.11.012. Epub 2010 Nov 30. Eur J Pharmacol. 2011. PMID: 21126518
-
Vitamin D3 restores altered cholinergic and insulin receptor expression in the cerebral cortex and muscarinic M3 receptor expression in pancreatic islets of streptozotocin induced diabetic rats.J Nutr Biochem. 2011 May;22(5):418-25. doi: 10.1016/j.jnutbio.2010.03.010. Epub 2010 Jul 23. J Nutr Biochem. 2011. PMID: 20655720
-
Cholinergic innervation and receptors in the cerebellum.Prog Brain Res. 1997;114:67-96. doi: 10.1016/s0079-6123(08)63359-2. Prog Brain Res. 1997. PMID: 9193139 Review.
-
Mini Review: the non-neuronal cardiac cholinergic system in type-2 diabetes mellitus.Front Cardiovasc Med. 2024 Sep 2;11:1425534. doi: 10.3389/fcvm.2024.1425534. eCollection 2024. Front Cardiovasc Med. 2024. PMID: 39314774 Free PMC article. Review.
Cited by
-
Sukkari dates seed improves type-2 diabetes mellitus-induced memory impairment by reducing blood glucose levels and enhancing brain cholinergic transmission: In vivo and molecular modeling studies.Saudi Pharm J. 2022 Jun;30(6):750-763. doi: 10.1016/j.jsps.2022.03.016. Epub 2022 Mar 29. Saudi Pharm J. 2022. PMID: 35812141 Free PMC article.
-
Brain Structural Alterations, Diabetes Biomarkers, and Cognitive Performance in Older Adults With Dysglycemia.Front Neurol. 2021 Oct 28;12:766216. doi: 10.3389/fneur.2021.766216. eCollection 2021. Front Neurol. 2021. PMID: 34777234 Free PMC article.
-
Partial blockade of nicotinic acetylcholine receptors improves the counterregulatory response to hypoglycemia in recurrently hypoglycemic rats.Am J Physiol Endocrinol Metab. 2014 Oct 1;307(7):E580-8. doi: 10.1152/ajpendo.00237.2014. Epub 2014 Aug 12. Am J Physiol Endocrinol Metab. 2014. PMID: 25117409 Free PMC article.
-
Corresponding risk factors between cognitive impairment and type 1 diabetes mellitus: A narrative review.Heliyon. 2022 Aug 3;8(8):e10073. doi: 10.1016/j.heliyon.2022.e10073. eCollection 2022 Aug. Heliyon. 2022. PMID: 35991978 Free PMC article. Review.
-
Direct effects of recurrent hypoglycaemia on adrenal catecholamine release.Diab Vasc Dis Res. 2015 Jan;12(1):2-12. doi: 10.1177/1479164114549755. Epub 2014 Sep 29. Diab Vasc Dis Res. 2015. PMID: 25268022 Free PMC article.
References
Publication types
MeSH terms
Substances
LinkOut - more resources
Full Text Sources
Medical
