

Comparative transcriptome analysis coupled to X-ray CT reveals sucrose supply and growth velocity as major determinants of potato tuber starch biosynthesis
- PMID: 20137087
- PMCID: PMC2827413
- DOI: 10.1186/1471-2164-11-93
Comparative transcriptome analysis coupled to X-ray CT reveals sucrose supply and growth velocity as major determinants of potato tuber starch biosynthesis
Abstract
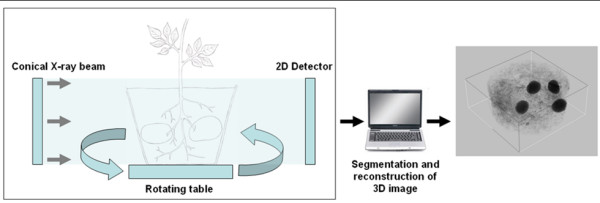
Background: Even though the process of potato tuber starch biosynthesis is well understood, mechanisms regulating biosynthesis are still unclear. Transcriptome analysis provides valuable information as to how genes are regulated. Therefore, this work aimed at investigating transcriptional regulation of starch biosynthetic genes in leaves and tubers of potato plants under various conditions. More specifically we looked at gene expression diurnally in leaves and tubers, during tuber induction and in tubers growing at different velocities. To determine velocity of potato tuber growth a new method based on X-ray Computed Tomography (X-ray CT) was established.
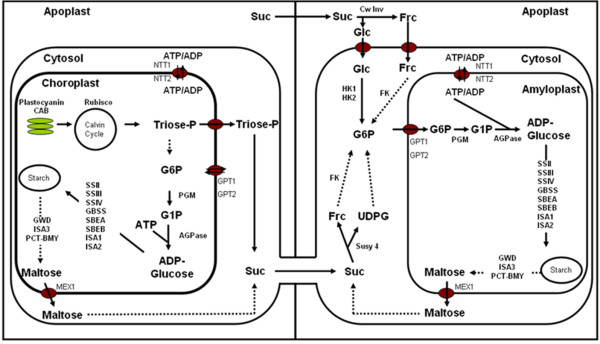
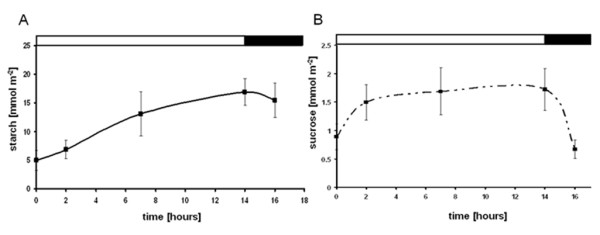
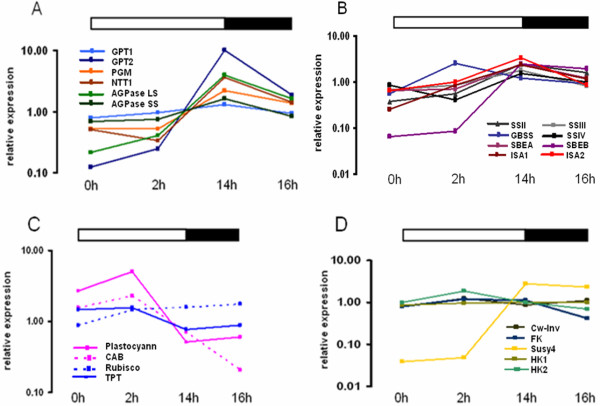
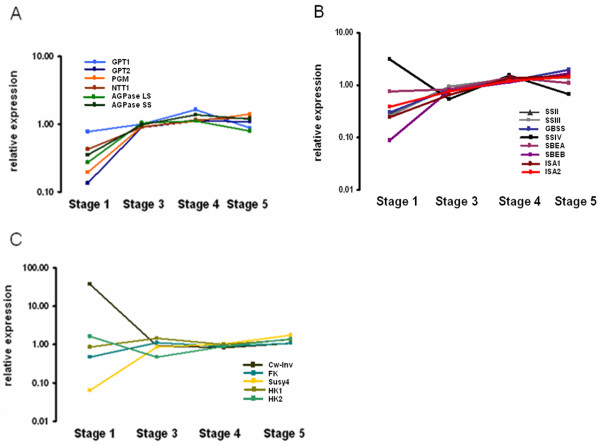
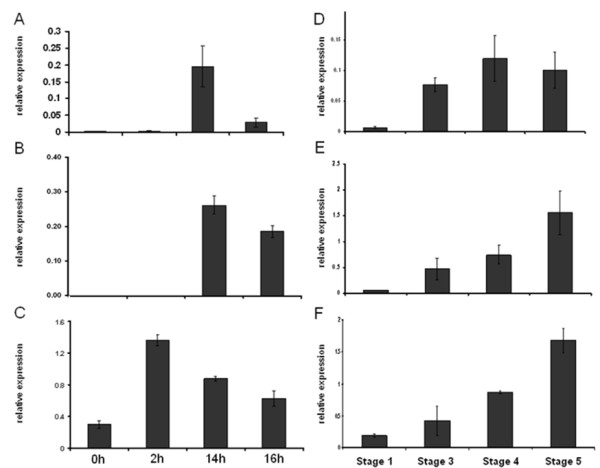
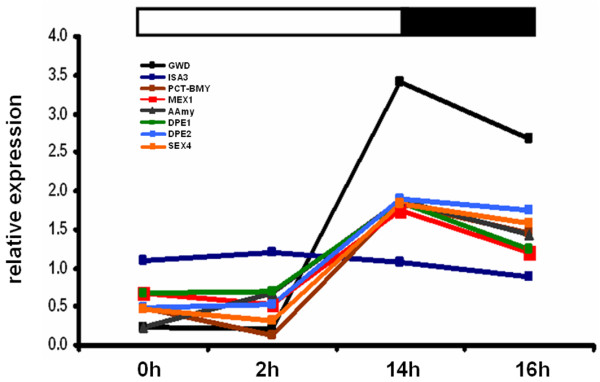
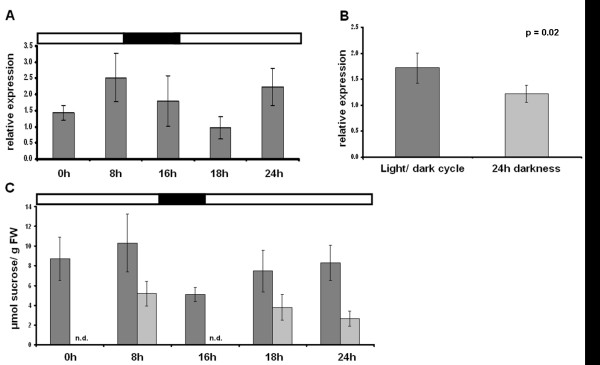
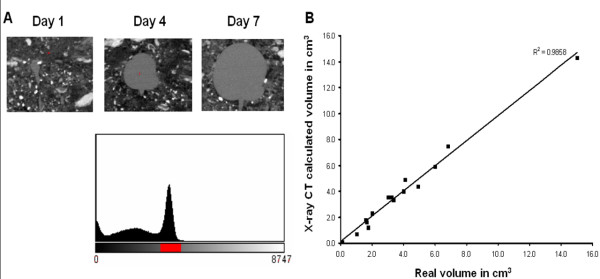
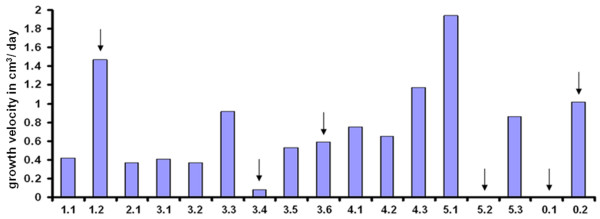
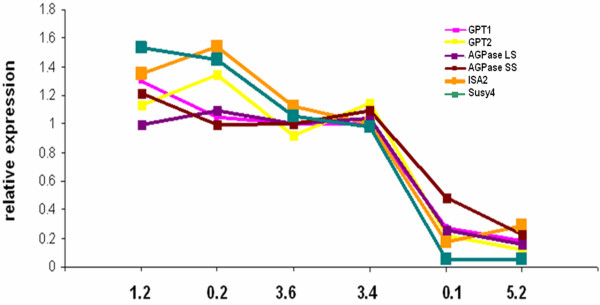
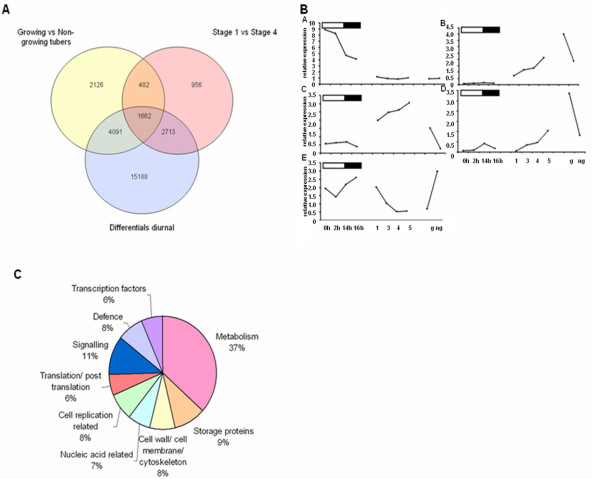
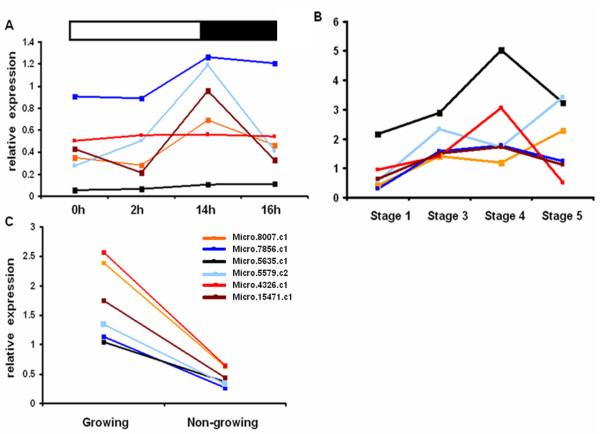
Results: Comparative transcriptome analysis between leaves and tubers revealed striking similarities with the same genes being differentially expressed in both tissues. In tubers, oscillation of granule bound starch synthase (GBSS) expression) was observed which could be linked to sucrose supply from source leaves. X-ray CT was used to determine time-dependent changes in tuber volume and the growth velocity was calculated. Although there is not a linear correlation between growth velocity and expression of starch biosynthetic genes, there are significant differences between growing and non-growing tubers. Co-expression analysis was used to identify transcription factors positively correlating with starch biosynthetic genes possibly regulating starch biosynthesis.
Conclusion: Most starch biosynthetic enzymes are encoded by gene families. Co-expression analysis revealed that the same members of these gene families are co-regulated in leaves and tubers. This suggests that regulation of transitory and storage starch biosynthesis in leaves and tubers, respectively, is surprisingly similar. X-ray CT can be used to monitor growth and development of belowground organs and allows to link tuber growth to changes in gene expression. Comparative transcriptome analysis provides a useful tool to identify transcription factors possibly involved in the regulation of starch biosynthesis.
Figures
Similar articles
-
Genome-wide analysis of starch metabolism genes in potato (Solanum tuberosum L.).BMC Genomics. 2017 Jan 5;18(1):37. doi: 10.1186/s12864-016-3381-z. BMC Genomics. 2017. PMID: 28056783 Free PMC article.
-
Potato STARCH SYNTHEASE 5 is critical for simple starch granule initiation in amyloplasts and tuber development.Plant J. 2025 May;122(4):e70206. doi: 10.1111/tpj.70206. Plant J. 2025. PMID: 40384309
-
Enhancing sucrose synthase activity in transgenic potato (Solanum tuberosum L.) tubers results in increased levels of starch, ADPglucose and UDPglucose and total yield.Plant Cell Physiol. 2009 Sep;50(9):1651-62. doi: 10.1093/pcp/pcp108. Epub 2009 Jul 16. Plant Cell Physiol. 2009. PMID: 19608713
-
Regulation of sucrose to starch conversion in growing potato tubers.J Exp Bot. 2003 Jan;54(382):457-65. doi: 10.1093/jxb/erg074. J Exp Bot. 2003. PMID: 12508056 Review.
-
Development of aerial and belowground tubers in potato is governed by photoperiod and epigenetic mechanism.Plant Physiol. 2021 Nov 3;187(3):1071-1086. doi: 10.1093/plphys/kiab409. Plant Physiol. 2021. PMID: 34734280 Free PMC article. Review.
Cited by
-
Identification of TIMING OF CAB EXPRESSION 1 as a temperature-sensitive negative regulator of tuberization in potato.J Exp Bot. 2019 Oct 24;70(20):5703-5714. doi: 10.1093/jxb/erz336. J Exp Bot. 2019. PMID: 31328229 Free PMC article.
-
The Xanthomonas campestris pv. vesicatoria Type-3 Effector XopB Inhibits Plant Defence Responses by Interfering with ROS Production.PLoS One. 2016 Jul 11;11(7):e0159107. doi: 10.1371/journal.pone.0159107. eCollection 2016. PLoS One. 2016. PMID: 27398933 Free PMC article.
-
Siglec-H protects from virus-triggered severe systemic autoimmunity.J Exp Med. 2016 Jul 25;213(8):1627-44. doi: 10.1084/jem.20160189. Epub 2016 Jul 4. J Exp Med. 2016. PMID: 27377589 Free PMC article.
-
X-Ray CT Phenotyping Reveals Bi-Phasic Growth Phases of Potato Tubers Exposed to Combined Abiotic Stress.Front Plant Sci. 2021 Mar 30;12:613108. doi: 10.3389/fpls.2021.613108. eCollection 2021. Front Plant Sci. 2021. PMID: 33859657 Free PMC article.
-
The mode of sucrose degradation in potato tubers determines the fate of assimilate utilization.Front Plant Sci. 2012 Feb 22;3:23. doi: 10.3389/fpls.2012.00023. eCollection 2012. Front Plant Sci. 2012. PMID: 22639642 Free PMC article.
References
-
- Kruger NJ. In: Plant Metabolism. Dennis DT, Turpin DH, Lefebvre DD, Layzell DB, editor. Harlow: Longman; 1997. Carbohydrate synthesis and degradation; pp. 83–104.
-
- Farrar JF. In: Carbon Partition within and Between Organisms. Pollock CJ, Farrar JF, Gordon AJ, editor. Oxford: Bios Scientific publishers; 1992. The whole plant: Carbon partitioning during development; pp. 163–179.
Publication types
MeSH terms
Substances
LinkOut - more resources
Full Text Sources
