

Oral sensory and cephalic hormonal responses to fat and non-fat liquids in bulimia nervosa
- PMID: 20138067
- PMCID: PMC2840197
- DOI: 10.1016/j.physbeh.2010.01.033
Oral sensory and cephalic hormonal responses to fat and non-fat liquids in bulimia nervosa
Abstract
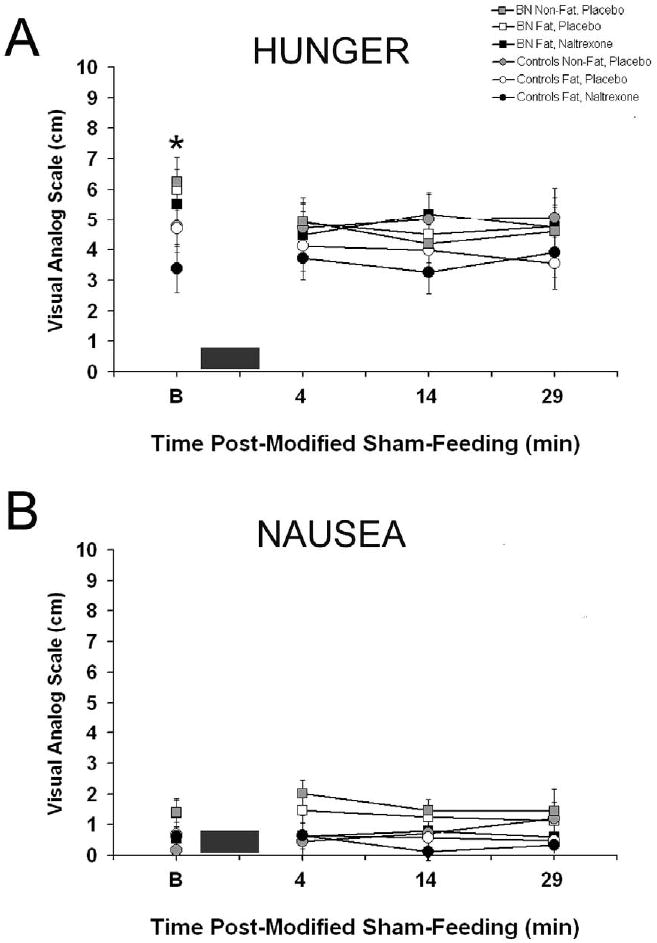
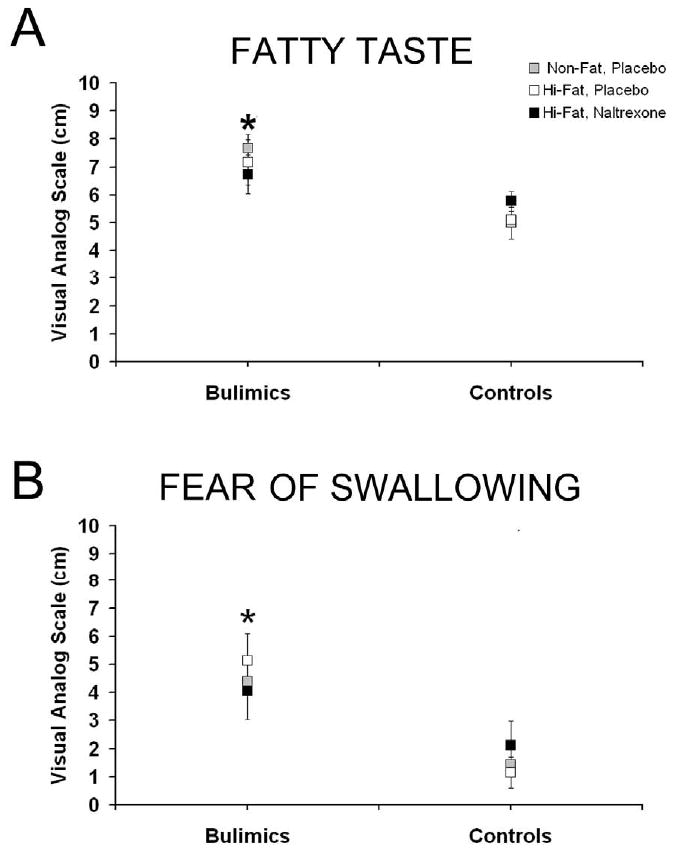
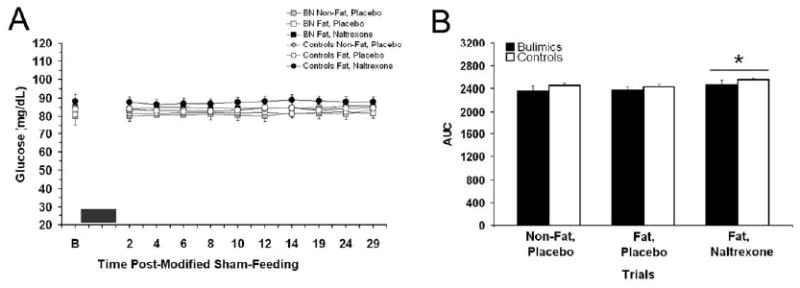
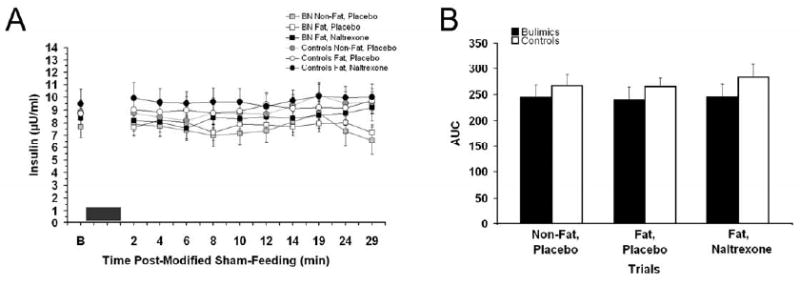
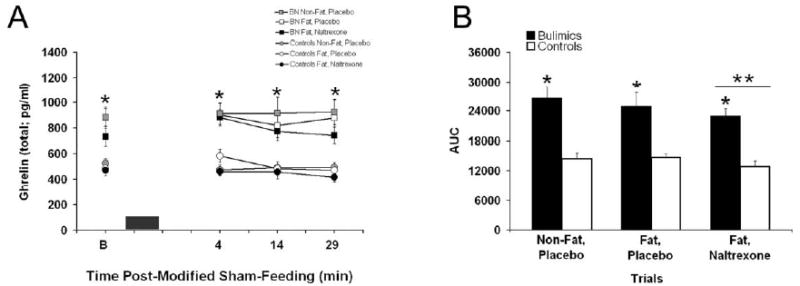
Sensory evaluation of food involves endogenous opioid mechanisms. Bulimics typically limit their food choices to low-fat "safe foods" and intermittently lose control and binge on high-fat "risk foods". The aim of this study was to determine whether the oral sensory effects of a fat versus a non-fat milk product (i.e., traditional versus non-fat half-and-half) resulted in different subjective and hormonal responses in bulimic women (n=10) compared with healthy women (n=11). Naltrexone (50mg PO) or placebo was administered 1h before, and blood sampling began 30 min prior to and 29 min after, a 3 min portion controlled modified sham-feeding trial. Following an overnight fast, three morning trials (fat, naltrexone; fat, placebo; and non-fat, placebo) were administered in a random double-blind fashion separated by at least 3 days. Overall, there were no differences between Fat and Non-Fat trials. Hunger ratings (p<0.001) and pancreatic polypeptide levels (p<0.05) were higher for bulimics at baseline. Bulimics also had overall higher ratings for nausea (p<0.05), fatty taste (p<0.01), and fear of swallowing (p<0.005). Bulimics had approximately 40% higher total ghrelin levels at all time points (p<0.001). Hormones and glucose levels were not altered by the modified sham-feeding paradigm. Naltrexone, however, resulted in an overall increase in blood glucose and decrease in ghrelin levels in both groups (p<0.05, for both). These data suggest that bulimic women have different orosensory responses that are not influenced by opioid receptor antagonism, evident in hormonal responses, or dependent on the fat content of a similarly textured liquid.
(c) 2010 Elsevier Inc. All rights reserved.
Figures
Similar articles
-
Tasting fat: cephalic phase hormonal responses and food intake in restrained and unrestrained eaters.Physiol Behav. 2006 Sep 30;89(2):213-20. doi: 10.1016/j.physbeh.2006.06.013. Epub 2006 Jul 17. Physiol Behav. 2006. PMID: 16846622
-
Modified sham feeding of foods with different macronutrient compositions differentially influences cephalic change of insulin, ghrelin, and NMR-based metabolomic profiles.Physiol Behav. 2014 Aug;135:135-42. doi: 10.1016/j.physbeh.2014.06.009. Epub 2014 Jun 18. Physiol Behav. 2014. PMID: 24952264
-
Enhanced ghrelin secretion in the cephalic phase of food ingestion in women with bulimia nervosa.Psychoneuroendocrinology. 2010 Feb;35(2):284-8. doi: 10.1016/j.psyneuen.2009.07.001. Epub 2009 Jul 23. Psychoneuroendocrinology. 2010. PMID: 19631473 Clinical Trial.
-
Afferent signals regulating food intake.Proc Nutr Soc. 2000 Aug;59(3):373-84. doi: 10.1017/s0029665100000422. Proc Nutr Soc. 2000. PMID: 10997653 Review.
-
Evidence for a vagal pathophysiology for bulimia nervosa and the accompanying depressive symptoms.J Affect Disord. 2006 May;92(1):79-90. doi: 10.1016/j.jad.2005.12.047. Epub 2006 Mar 3. J Affect Disord. 2006. PMID: 16516303 Review.
Cited by
-
Preliminary examination of glucagon-like peptide-1 levels in women with purging disorder and bulimia nervosa.Int J Eat Disord. 2015 Mar;48(2):199-205. doi: 10.1002/eat.22264. Epub 2014 Mar 4. Int J Eat Disord. 2015. PMID: 24590464 Free PMC article.
-
Causal relationship between bulimia nervosa and microstructural white matter: evidence from Mendelian randomization.Eat Weight Disord. 2025 May 19;30(1):41. doi: 10.1007/s40519-025-01754-z. Eat Weight Disord. 2025. PMID: 40388076 Free PMC article.
-
Novel potential pharmacological approaches in treating eating disorders comorbid with substance use disorders.Biomed Pharmacother. 2025 Aug;189:118327. doi: 10.1016/j.biopha.2025.118327. Epub 2025 Jul 4. Biomed Pharmacother. 2025. PMID: 40616879 Review.
-
Role of ghrelin in the pathophysiology of eating disorders: implications for pharmacotherapy.CNS Drugs. 2012 Apr 1;26(4):281-96. doi: 10.2165/11599890-000000000-00000. CNS Drugs. 2012. PMID: 22452525 Review.
-
High-fat taste challenge reveals altered striatal response in women recovered from bulimia nervosa: A pilot study.World J Biol Psychiatry. 2014 May;15(4):307-16. doi: 10.3109/15622975.2012.671958. Epub 2012 Apr 30. World J Biol Psychiatry. 2014. PMID: 22540408 Free PMC article.
References
-
- American Psychiatric Association. Diagnostic and statistical manual of mental disorders: DSM-IV. 4th. Washington, DC: American Psychiatric Association; 1994. American Psychiatric Association. Task Force on DSM-IV; p. xxvii.p. 886.
-
- Hetherington MM. Cues to overeat: psychological factors influencing overconsumption. Proc Nutr Soc. 2007;66(1):113–23. - PubMed
-
- Hetherington MM, Rolls BJ. Dysfunctional eating in the eating disorders. Psychiatr Clin North Am. 2001;24(2):235–48. - PubMed
-
- Kales EF. Macronutrient analysis of binge eating in bulimia. Physiol Behav. 1990;48(6):837–40. - PubMed
-
- Hetherington MM, Altemus M, Nelson ML, Bernat AS, Gold PW. Eating behavior in bulimia nervosa: multiple meal analyses. Am J Clin Nutr. 1994;60(6):864–73. - PubMed
Publication types
MeSH terms
Substances
Grants and funding
LinkOut - more resources
Full Text Sources
Medical
