

Assessment of the hemorheological profile of koala and echidna
- PMID: 20138490
- PMCID: PMC2859317
- DOI: 10.1016/j.zool.2009.07.003
Assessment of the hemorheological profile of koala and echidna
Abstract
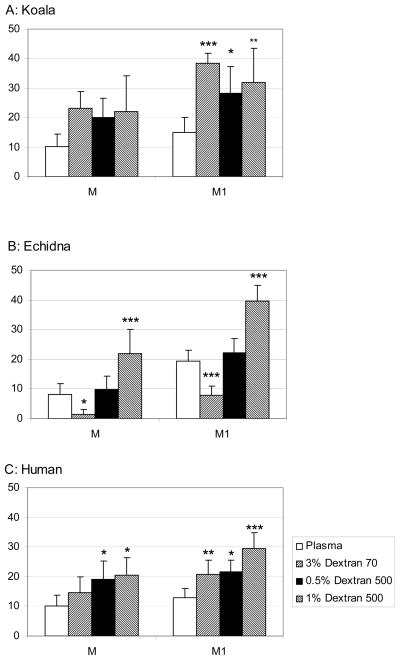
Koala, a marsupial, and echidna, a monotreme, are mammals native to Australia. Blood viscosity (62.5-1250s(-1)), red blood cell (RBC) deformability, RBC aggregation, aggregability and surface charge, and hematological parameters were measured in blood samples from six koalas and six echidnas and compared to adult human blood. Koala had the largest RBC mean cell volume (107.7+/-2.6fl) compared to echidna (81.3+/-2.6fl) and humans (88.4+/-1.2fl). Echidna blood exhibited the highest viscosity over the entire range of shear rates. Echidna RBC were significantly less deformable than koala RBC but more deformable than human RBC. Echidna RBC had significantly lower aggregability (i.e., aggregation in standardized dextran medium) than koala or human RBC, while aggregation in autologous plasma was similar for the three species. Erythrocyte surface charge as indexed by RBC electrophoretic mobility was similar for human and echidna cells but was 40% lower for koala RBC. Data obtained during this preliminary study indicate that koala and echidna have distinct hemorheological characteristics; investigation of these properties may reveal patterns relevant to specific behavioral and physiological features of these animals.
Figures


References
-
- Agar NS, Reinke NB, Godwin IR, Kuchel PW. Comparative biochemistry of marsupial erythrocytes: a review. Comp Haematol Int. 2000;10:148–167.
-
- Baskurt OK. Deformability of red blood cells from different species studied by resistive pulse shape analysis technique. Biorheology. 1996;33:169–179. - PubMed
-
- Baskurt OK, Meiselman HJ. Blood rheology and hemodynamics. Semin Thromb Hemost. 2003;29:435–450. - PubMed
-
- Baskurt OK, Meiselman HJ. Analyzing shear stress-elongation index curves: comparison of two approaches to simplify data presentation. Clin Hemorheol Microcirc. 2004;31:23–30. - PubMed
-
- Baskurt OK, Farley RA, Meiselman HJ. Erythrocyte aggregation tendency and cellular properties in horse, human, and rat: a comparative study. Am J Physiol. 1997;273:H2604–H2612. - PubMed
Publication types
MeSH terms
Grants and funding
LinkOut - more resources
Full Text Sources
