. 2010 May;31(13):3479-91.
doi: 10.1016/j.biomaterials.2010.01.074. Epub 2010 Feb 6.

Characterization of topographical effects on macrophage behavior in a foreign body response model

Affiliations

Characterization of topographical effects on macrophage behavior in a foreign body response model

Sulin Chen et al. Biomaterials. 2010 May.

Abstract

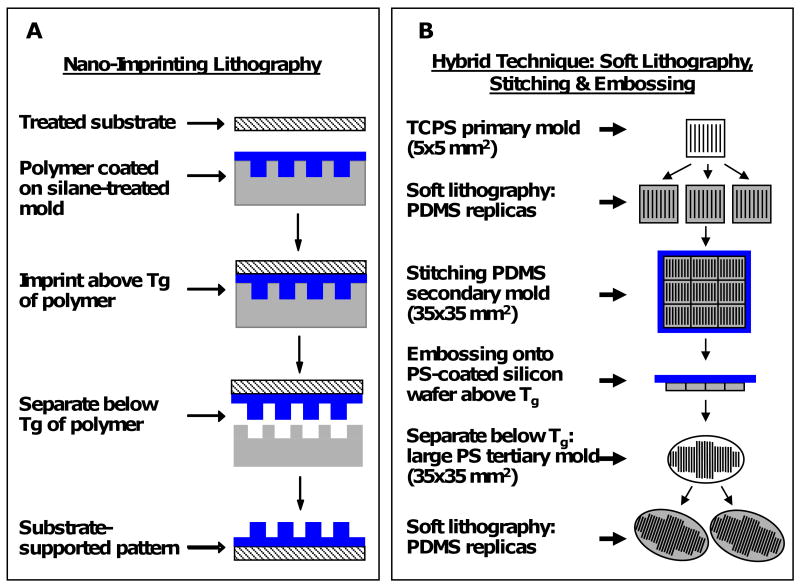
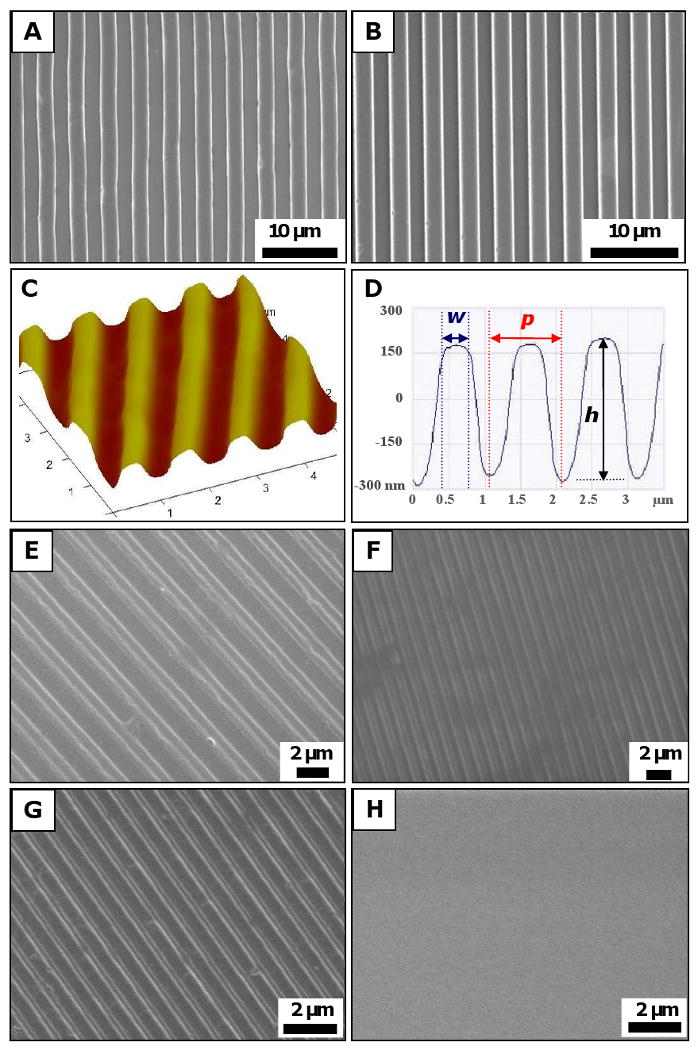
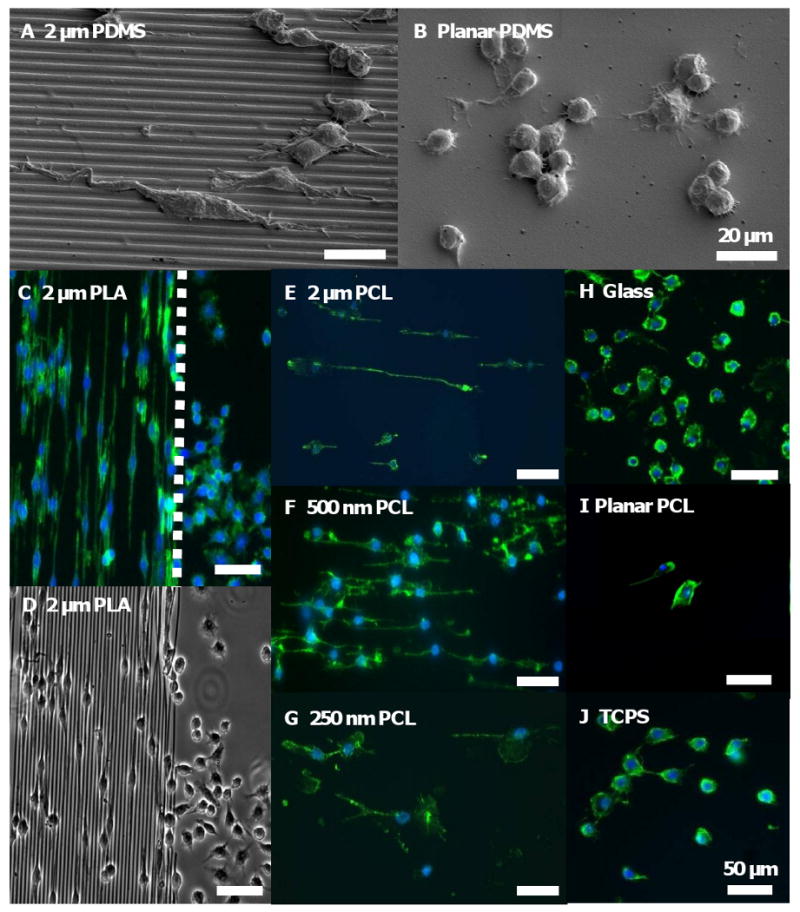
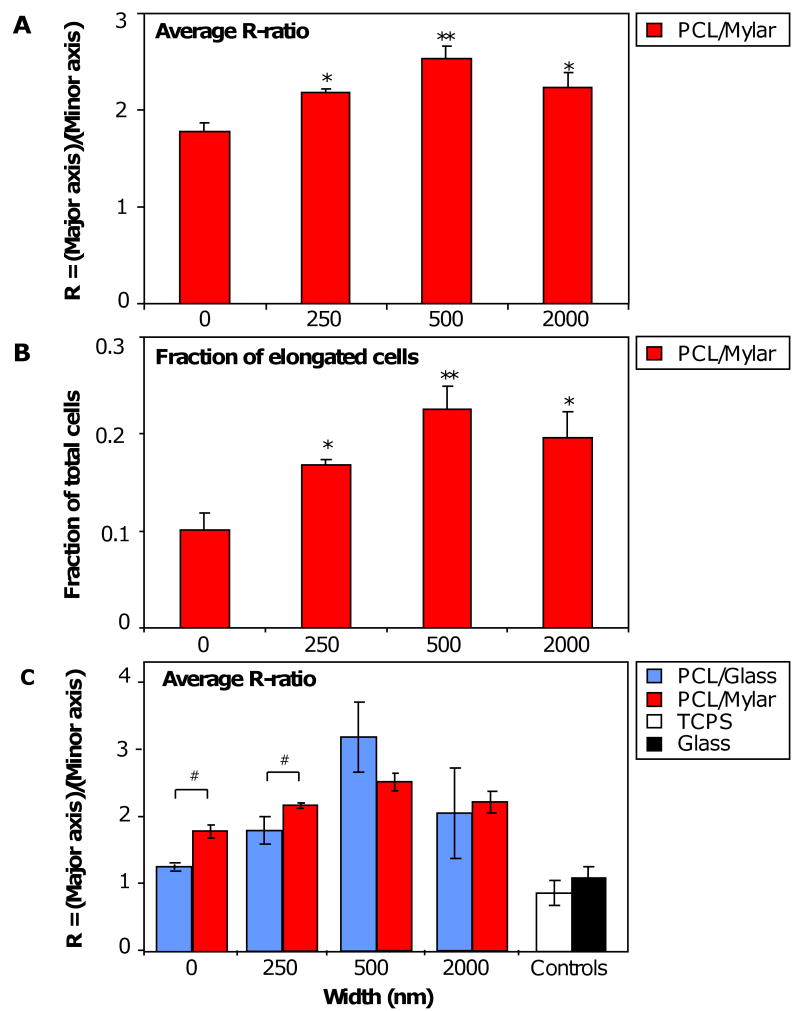
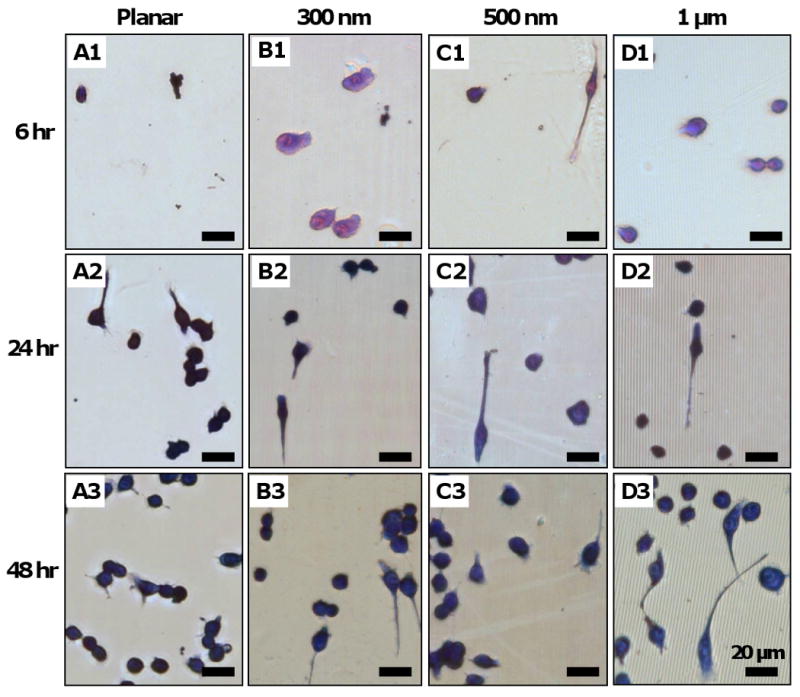
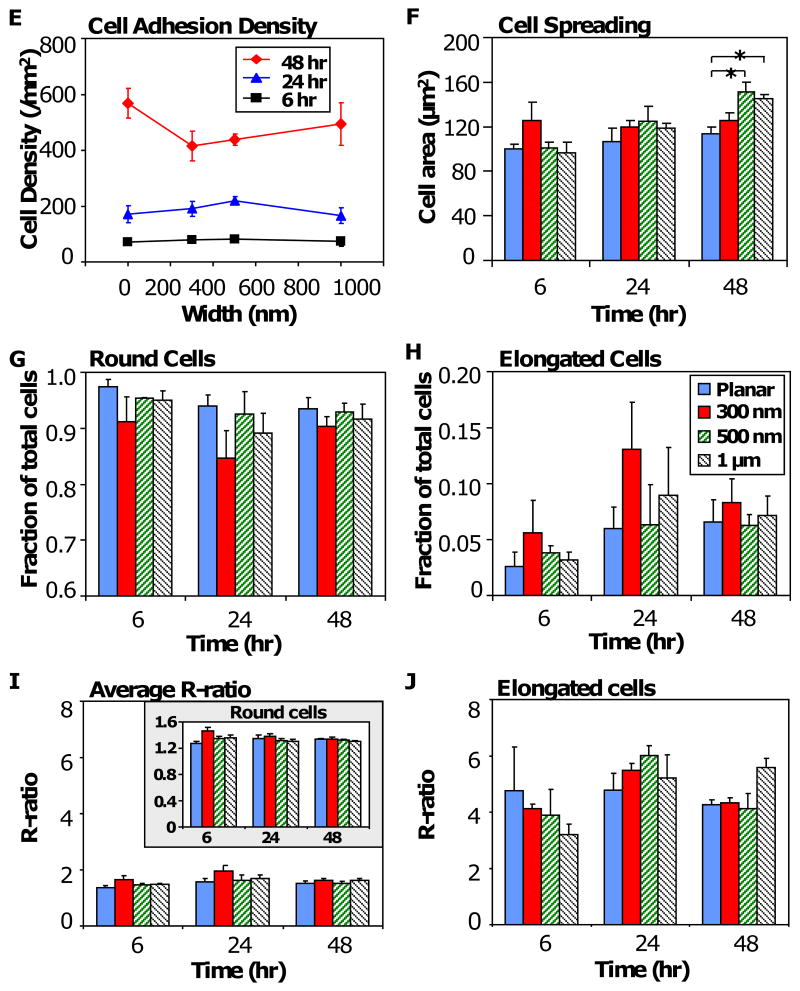
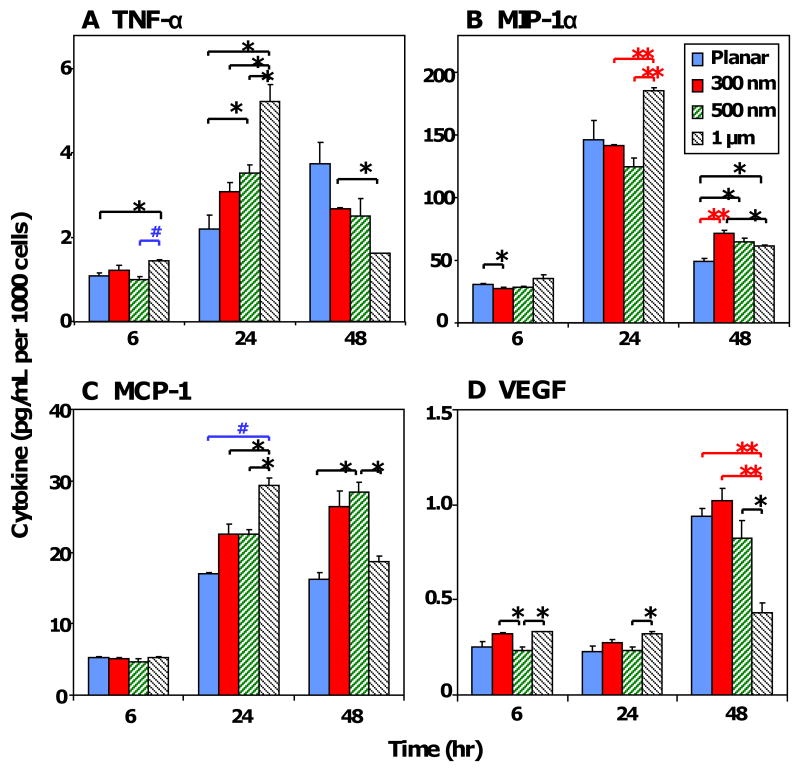
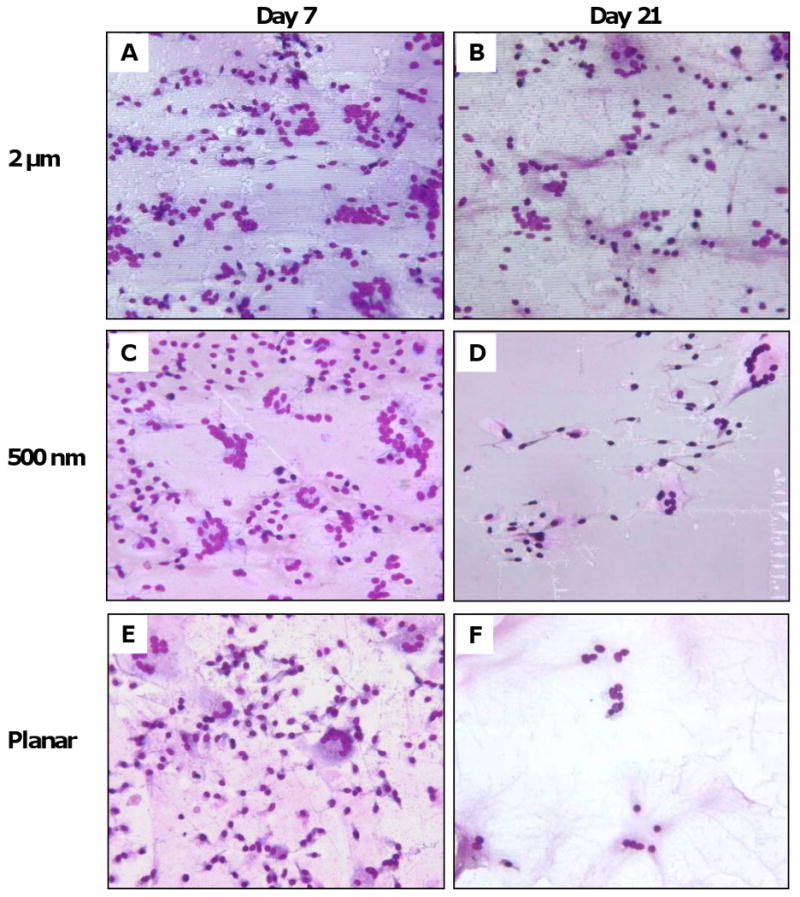
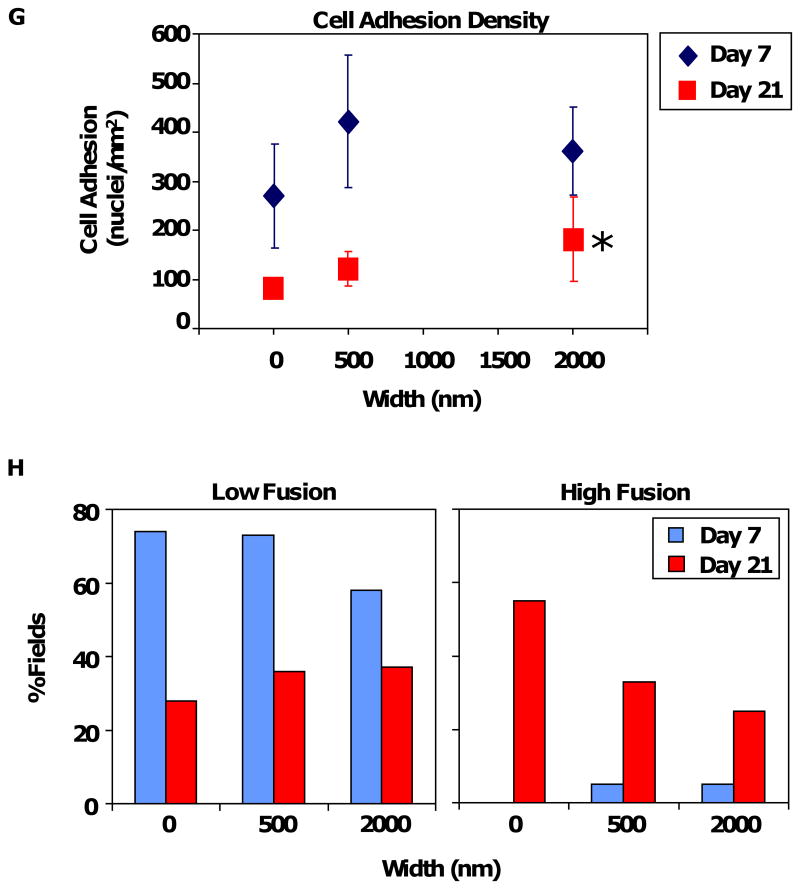
Current strategies to limit macrophage adhesion, fusion and fibrous capsule formation in the foreign body response have focused on modulating material surface properties. We hypothesize that topography close to biological scale, in the micron and nanometric range, provides a passive approach without bioactive agents to modulate macrophage behavior. In our study, topography-induced changes in macrophage behavior was examined using parallel gratings (250 nm-2 mum line width) imprinted on poly(epsilon-caprolactone) (PCL), poly(lactic acid) (PLA) and poly(dimethyl siloxane) (PDMS). RAW 264.7 cell adhesion and elongation occurred maximally on 500 nm gratings compared to planar controls over 48 h. TNF-alpha and VEGF secretion levels by RAW 264.7 cells showed greatest sensitivity to topographical effects, with reduced levels observed on larger grating sizes at 48 h. In vivo studies at 21 days showed reduced macrophage adhesion density and degree of high cell fusion on 2 mum gratings compared to planar controls. It was concluded that topography affects macrophage behavior in the foreign body response on all polymer surfaces examined. Topography-induced changes, independent of surface chemistry, did not reveal distinctive patterns but do affect cell morphology and cytokine secretion in vitro, and cell adhesion in vivo particularly on larger size topography compared to planar controls.


Conflict of interest statement

The authors confirm that there are no known conflicts of interest associated with this publication and there has been no significant financial support for this work that could have influenced its outcome.

Figures

Figure 1
Figure 1. Topographical substrate fabrication process
Schematics of (A) the nanoimprint lithography fabrication process, and (B) the hybrid fabrication technique combining soft lithography, stitching and embossing. PCL and PLA gratings were fabricated using the NIL technique, and PDMS gratings were fabricated using the hybrid technique.
Figure 2
Figure 2. Substrate characterization
SEM micrographs of substrates fabricated using NIL technique: (A) 2 μm PCL gratings, and (B) 2 μm PLA gratings on treated glass. AFM characterization of (C) a 5×5 μm2 scan area on a 500 nm PCL sample imprinted on Mylar showed (D) dimensions of 500 nm width (w), 500 nm height (h) and 1 μm period (p). SEM micrographs of constant height PDMS gratings showed that the hybrid technique was successful in transferring patterns from rigid mold to PDMS replicas with high fidelity: (E) 1 μm grating width, (F) 500 nm gratings width, (G) 300 nm gratings width, and (H) planar controls. Scale bar = 10 μm (A-B), and 2 μm (E-H).
Figure 3
Figure 3. Macrophage morphology changes on topographical gratings compared to planar controls
SEM micrographs of RAW 264.7 cultured on (A) 2 μm PDMS gratings for 48 hr showed that cells elongated in the direction of the gratings, but (B) maintained its native round morphology on the planar PDMS control. (C) Fluorescent staining of adherent RAW 264.7 cultured on 2 μm PLA gratings imprinted on glass for 48 hr showed distinct cell elongation in the direction of the gratings, in contrast to cells with round morphology on the planar border (dotted white line). (D) A phase contrast image of the sample clearly showed the border between the 2 μm PLA gratings and its planar surface. Cell elongation was similarly observed on PCL gratings imprinted on glass at 48 hr: (E) 2 μm gratings width, (F) 500 nm gratings width, and (G) 250 nm gratings width. In contrast, cells retained its native round shape on planar controls such as (H) glass, (I) planar PCL film and (J) tissue culture polystyrene (TCPS). F-actin and cell nuclei immunostaining were performed by Phalloidin Oregon Green-488 (green) and DAPI (blue), respectively. Scale bar = 20 μm (A-B), and 50 μm (C-J).
Figure 4
Figure 4. Morphometric analysis of RAW 264.7 on NIL substrates. (A)
The average elongation ratio, R-ratio = (length of major axis)/(length of minor axis), of adherent cells on PCL gratings imprinted on Mylar showed statistical significance on all grating sizes compared to planar PCL controls: 250 nm (*p<0.05), 500 nm (*p<0.01) and 2 μm (*p<0.05). The average R-ratio increased from planar to 500 nm gratings but decreased on 2 μm gratings. (B) Of the total adherent cells, a small fraction (<25%) of cells were elongated in the same direction (within 30° angle) as the gratings. The changes in fraction of elongated cells (defined as R≥2.5) to topography shared the same trend as changes in average R-ratio, and were statistically significant compared to planar controls. (C) A comparison of average R-ratio on PCL gratings imprinted onto different treated surfaces (glass vs. Mylar) showed similar trends of increasing up to 500 nm but decreasing at 2 μm, with statistical significance (#p<0.05) between cells on planar glass vs Mylar (0 nm) and between cells on 250 nm glass vs 250 nm Mylar. Statistical analysis with student's t-test or one-way ANOVA comparison followed by Tukey's post-hoc test was used where needed. Statistical significance was noted at *p<0.05 and **p<0.01.
Figure 5
Figure 5. RAW 264.7 response to PDMS topography
Photomicrographs of adherent cells on PDMS gratings and controls of constant height (at 350 nm): planar control (Column A), 300 nm gratings (Column B), 500 nm gratings (Column D), and 1μm gratings. Across all gratings size, cell adhesion was observed on 6 hr samples (A1-D1), while cell elongation in the direction of gratings was observed at 24 hr (A2-D2), and 48 hr (A3-D3). Morphometric analysis of adherent cells on PDMS topography showed (E) no statistical difference in cell adhesion density due to topography at 6 hr, 24 hr and 48 hr. (F) Cell spreading area was comparable at 6 hr and 24 hr, but was considered significant on 500 nm (p<0.05) and 1 μm gratings (p<0.05) compared to planar control at 48 hr. (G) A major fraction of total adherent cells (>85%) retain its native round shape, while (H) a small fraction of cells (<15%) acquired an elongated morphology of R≥2.5, with comparable levels across each pattern. (I) The average R-ratio of adherent cells (R-ratio = 1 to 2) was similarly comparable to that of round cells (I, inset). In contrast, (J) the R-ratio of elongated cells on each topographical pattern was higher (R-ratio = 3 to 4) but was not considered statistically significant. Data is reported as mean ± standard error of the mean (sample size, n = 3). ANOVA/Tukey's post hoc statistical test was used to examine data, and significance was determined at *p<0.05. Scale bar = 20 μm, May-Grünwald Giemsa stain, direction of gratings = vertical (B1-D3).
Figure 6
Figure 6. Cytokine secretion profile normalized to cell number
The normalized cytokine secretion levels of cells (pg/mL per 1000 cells) in response to PDMS topography were detected using multiplex immunoassay for (A) TNF-α, (B) MIP-1α, (C) MCP-1, and (D) VEGF. Data is reported as mean ± standard error of the mean (n=3). ANOVA/Tukey's post hoc statistical test was used to examine data, and significance was determined at *p<0.05, #p<0.01, **p<0.005.
Figure 7
Figure 7. In vivo cellular adhesion and fusion on PCL gratings imprinted on Mylar
Photomicrographs of macrophage cell adhesion and fusion on PCL/Mylar samples: (A-B) 2 μm gratings, (C-D) 500 nm gratings, and (E-F) planar Mylar control, at Day 7 (A, C, E) and Day 21 (B, D, F). (G) Cell adhesion density due to topography was comparable across all PCL gratings sizes at Day 7 (diamonds), then decreasing at Day 21 (squares). Adhesion density on 2 μm PCL gratings was statistically significant compared to planar Mylar controls (*p<0.05). (H) Low fusion (<10% of fields with the corresponding percent FBGC fusion) decreased as grating size increased at Day 7, but the trend was reversed on Day 21. In contrast, high fusion (>90% of fields with the corresponding percent FBGC fusion) was low at Day 7 but increased at Day 21, with a trend of decreasing high fusion on larger gratings. Magnification = 20×, May-Grünwald Giemsa stain (A-F).

Similar articles

Cited by

References

    1. Williams DF. On the mechanisms of biocompatibility. Biomaterials. 2008;29:2941–53. - PubMed
    1. Anderson JM, Rodriguez A, Chang DT. Foreign body reaction to biomaterials. Semin Immunol. 2008;20:86–100. - PMC - PubMed
    1. Ratner BD, Bryant SJ. Biomaterials: where we have been and where we are going. Annu Rev Biomed Eng. 2004;6:41–75. - PubMed
    1. Atienza C, Maloney WJ. Highly cross-linked polyethylene bearing surfaces in total hip arthroplasty. J Surg Orthop Adv. 2008;17:27–33. - PubMed
    1. Santerre JP, Woodhouse K, Laroche G, Labow RS. Understanding the biodegradation of polyurethanes: from classical implants to tissue engineering materials. Biomaterials. 2005;26:7457–70. - PubMed

Publication types

Substances