. 2010 Apr 9:1324:34-42.
doi: 10.1016/j.brainres.2010.01.088. Epub 2010 Feb 6.

Developmental appearance and disappearance of cortical events and oscillations in infant rats

Affiliations

Developmental appearance and disappearance of cortical events and oscillations in infant rats

Adele M H Seelke et al. Brain Res. .

Abstract

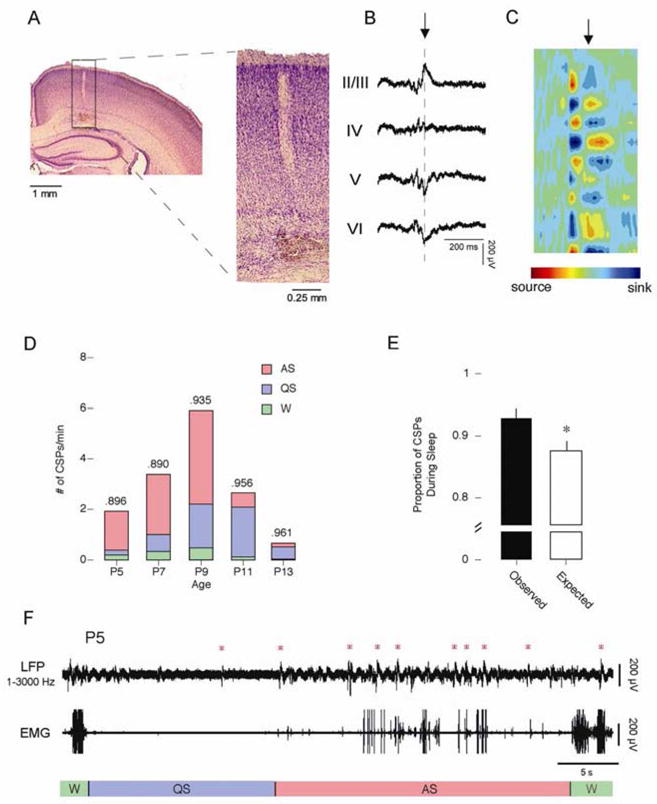
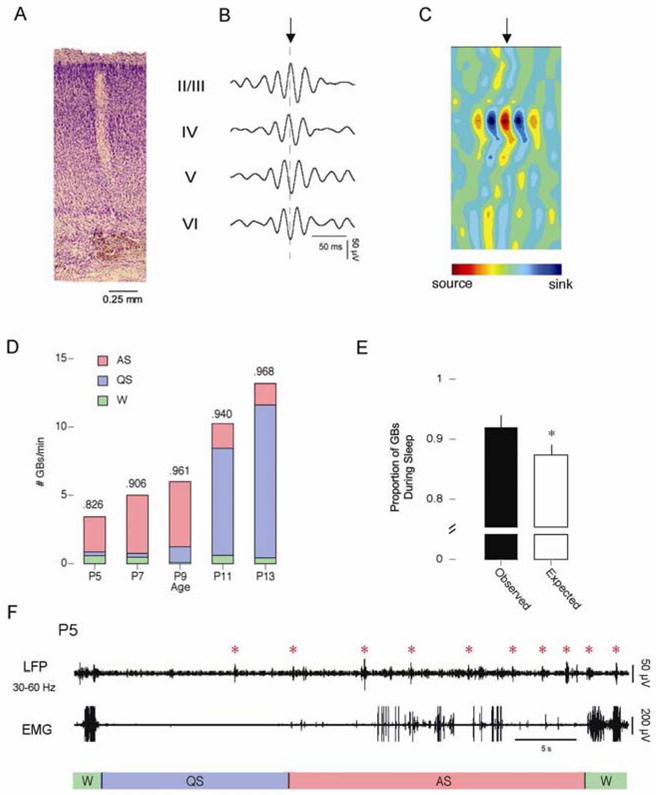
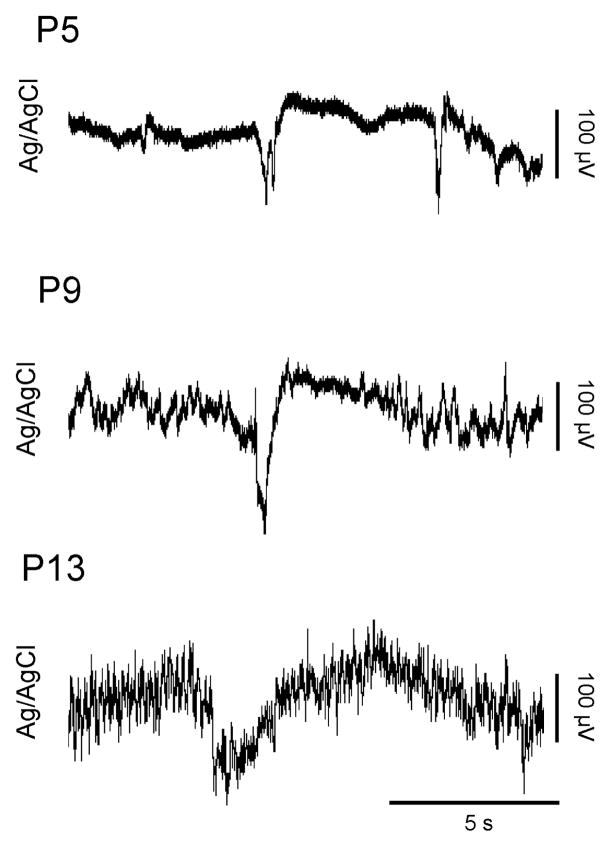
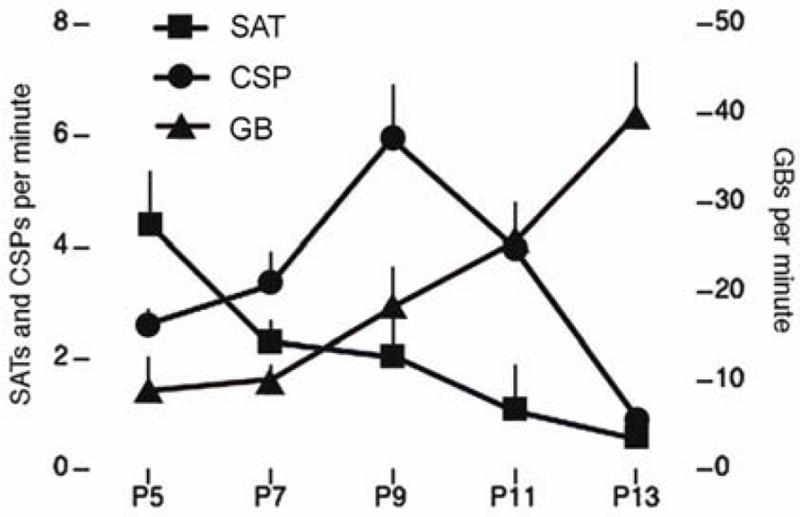
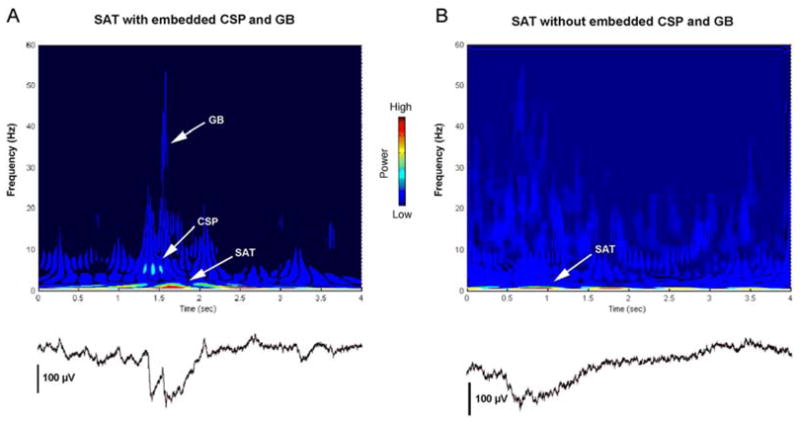
Until recently, organized and state-dependent neocortical activity in infant rats was thought to commence with the emergence of delta waves at postnatal day (P)11. This view is changing with the discovery of several forms of cortical activity that are detectable soon after birth, including spindle bursts (SBs) and slow activity transients (SATs). Here we provide further evidence of surprisingly rich cortical activity patterns during early development and document, in P5-P13 rats, the appearance, disappearance, and transient expression of three cortical events and oscillations. EEG activity in frontal, parietal, and occipital cortices was recorded in unanesthetized, head-fixed subjects using 16-channel laminar silicon electrodes and Ag-AgCl electrodes. In addition to SATs, we identified two novel forms of activity: cortical sharp potentials (CSPs) and gamma bursts (GBs). SBs were not observed in these areas. CSPs, defined as discrete, biphasic events with a duration of 250 ms, exhibited an inverted-U developmental trajectory with peak prevalence at P9. In contrast, GBs, defined as brief bursts of 40-Hz activity, increased steadily in prevalence and duration from P5 through P13. The prevalence of SATs decreased steadily across the ages tested here. Furthermore, both CSPs and GBs were more likely to occur during sleep than during wakefulness. Because SATs, CSPs, and GBs exhibit different developmental trajectories and rates of occurrence, and can occur independently of each other, they appear to be distinct patterns of neuronal activity. We hypothesize that these diverse patterns of neurophysiological activity reflect the instantaneous local structure and connectivity of the developing neocortex.


Figures

Figure 1
Figure 1
Cortical sharp potentials. A) Location of Si electrode recording site. The right panel shows an expanded view of the rectangle highlighted in A. Cortical layers are identified to the right. B) Representative CSP with embedded GB (Filtered from 1–3000 Hz). The point of phase reversal is identified with a dashed line. C) Current source density (CSD) analysis of averaged CSPs. All 16 channels were used to generate the CSD. Alternating sources (red) and sinks (blue) of ion flows are depicted. The point in the CSD identified by the arrow corresponds to the point in the CSP marked by the arrow in C. D) The number of CSPs per minute across development. The total number of events is broken down to depict the number of events that occurred during AS (red), QS (blue), and wakefulness (green). The proportion of each event that occurred during sleep is given at the top of the column. E) The observed (black) and expected (white) proportion of CSPs that occurred during wakefulness (left) and sleep (right). * significantly different from observed. Mean + s.e. F) Representative sleep-wake cycle from a P5 subject. The top trace depicts cortical activity measured using a Si electrode and filtered from 1–3000 Hz. The bottom trace depicts nuchal EMG activity. Behavioral states are indicated beneath the EMG trace. Red asterisks indicate CSPs.
Figure 2
Figure 2
Gamma bursts. A) Expanded view of a Si electrode recording site in a P9 rat. Cortical layers are identified to the right. B) Representative GB (Filtered from 30–60 Hz). The point of phase reversal is identified with a dashed line. C) Current source density (CSD) analysis of averaged GBs. All 16 channels were used to generate the CSD. Alternating sources (red) and sinks (blue) of ion flows are depicted. The point in the waveform identified by the arrow corresponds to the point in the GB marked by the arrow in B. D) The number of GBs per minute across development. The total number of events is broken down to depict the number of events that occurred during AS (red), QS (blue), and wakefulness (green). The proportion of each event that occurred during sleep is given at the top of the column. E) The observed (black) and expected (white) proportion of CSPs that occurred during wakefulness (left) and sleep (right). * significantly different from observed. Mean + s.e. F) Representative sleep-wake cycle from a P5 subject. The top trace depicts cortical activity measured using a Si electrode and filtered from 30–60 Hz. The bottom trace depicts nuchal EMG activity. Behavioral states are indicated beneath the EMG trace. Red asterisks indicate GBs.
Figure 3
Figure 3
Representative SATs from rats at P5 (top), P9 (middle) and P13 (bottom). Note how the duration of the SATs and their complexity increase with age.
Figure 4
Figure 4
Distinct developmental trajectories of SATs (squares), CSPs (circles), and GBs (triangles) between P5 and P13. Mean + s.e.
Figure 5
Figure 5
(A) Wavelet analysis of an SAT co-occurring with a CSP and a GB. The CSP and GB are both embedded within the SAT, and can be clearly seen in the corresponding local field potential (below). The SAT has dominant frequency of <1 Hz, the CSP has a dominant frequency of 5–15 Hz, and the GB has a dominant frequency of 30–55 Hz. (B) Wavelet analysis of an SAT occurring in isolation, with the corresponding local field potential (below). The SAT depicted here has a dominant frequency of <1 Hz.

References

    1. Beierlein M, Gibson JR, Connors BW. A network of electrically coupled interneurons drives synchronized inhibition in neocortex. Nature Neuroscience. 2000;3:904–10. - PubMed
    1. Ben-Ari Y. Excitatory actions of GABA during development: The nature of the nurture. Nature Reviews Neuroscience. 2002;3:728–739. - PubMed
    1. Blumberg MS, Seelke AMH, Lowen SB, Karlsson KÆ. Dynamics of sleep-wake cyclicity in developing rats. Proceedings of the National Academy of Science. 2005;102:14860–14864. - PMC - PubMed
    1. Frank MG, Heller HC. Development of REM and slow wave sleep in the rat. American Journal of Physiology. 1997;272:R1792–R1799. - PubMed
    1. Gramsbergen A. The development of the EEG in the rat. Developmental Psychobiology. 1976;9:501–515. - PubMed

Publication types