

A cross-laboratory comparison of expression profiling data from normal human postmortem brain
- PMID: 20138973
- PMCID: PMC2849877
- DOI: 10.1016/j.neuroscience.2010.01.016
A cross-laboratory comparison of expression profiling data from normal human postmortem brain
Abstract
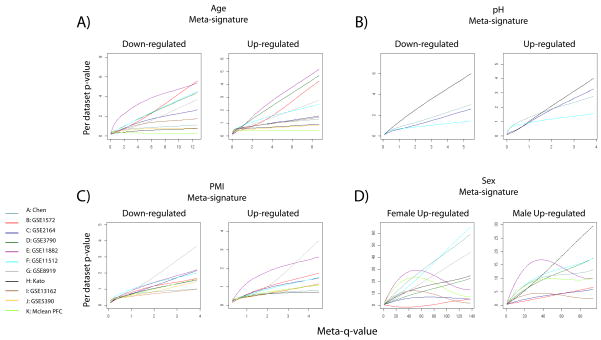
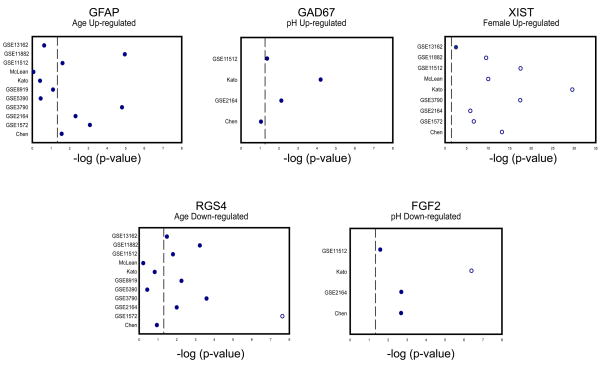
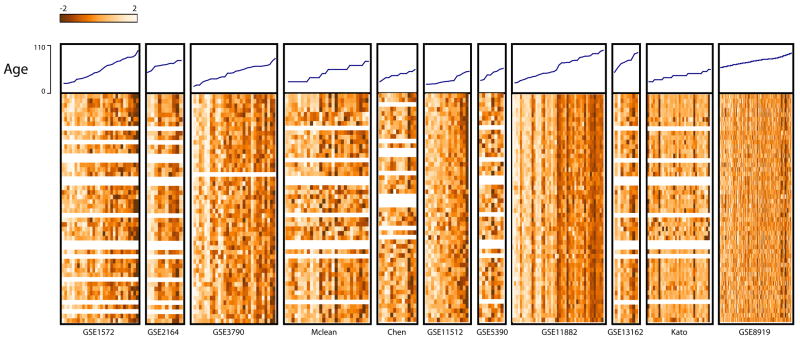
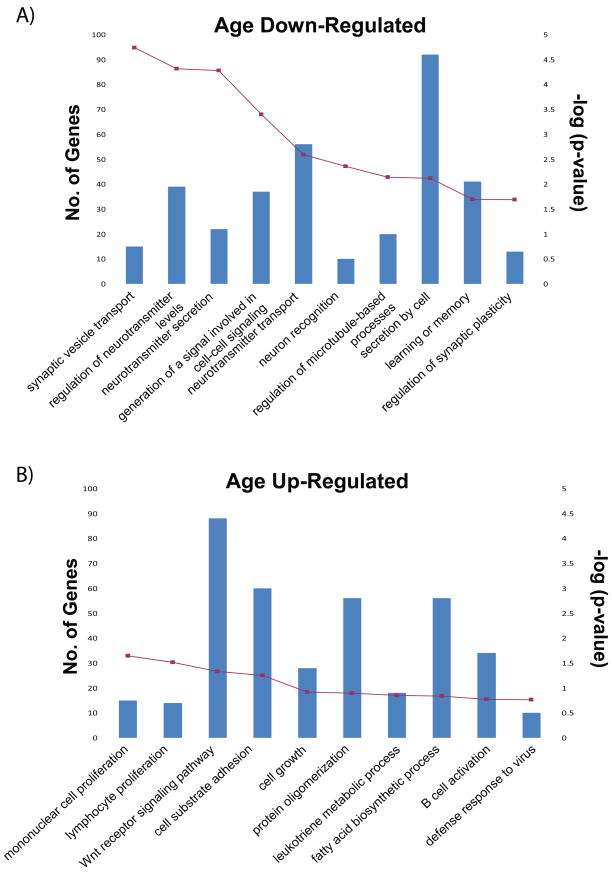
Expression profiling of post-mortem human brain tissue has been widely used to study molecular changes associated with neuropsychiatric diseases as well as normal processes such as aging. Changes in expression associated with factors such as age, gender or postmortem interval are often more pronounced than changes associated with disease. Therefore in addition to being of interest in their own right, careful consideration of these effects are important in the interpretation of disease studies. We performed a large meta-analysis of genome-wide expression studies of normal human cortex to more fully catalogue the effects of age, gender, postmortem interval and brain pH, yielding a "meta-signature" of gene expression changes for each factor. We validated our results by showing a significant overlap with independent gene lists extracted from the literature. Importantly, meta-analysis identifies genes which are not significant in any individual study. Finally, we show that many schizophrenia candidate genes appear in the meta-signatures, reinforcing the idea that studies must be carefully controlled for interactions between these factors and disease. In addition to the inherent value of the meta-signatures, our results provide critical information for future studies of disease effects in the human brain.
(c) 2010 IBRO. Published by Elsevier Ltd. All rights reserved.
Figures
Similar articles
-
Brain pH has a significant impact on human postmortem hippocampal gene expression profiles.Brain Res. 2006 Aug 23;1106(1):1-11. doi: 10.1016/j.brainres.2006.05.043. Epub 2006 Jul 14. Brain Res. 2006. PMID: 16843448
-
Quantifying mRNA in postmortem human brain: influence of gender, age at death, postmortem interval, brain pH, agonal state and inter-lobe mRNA variance.Brain Res Mol Brain Res. 2003 Oct 21;118(1-2):60-71. doi: 10.1016/s0169-328x(03)00337-1. Brain Res Mol Brain Res. 2003. PMID: 14559355
-
Methodological considerations for gene expression profiling of human brain.J Neurosci Methods. 2007 Jul 30;163(2):295-309. doi: 10.1016/j.jneumeth.2007.03.022. Epub 2007 Apr 8. J Neurosci Methods. 2007. PMID: 17512057 Free PMC article.
-
Postmortem brain tissue as an underutilized resource to study the molecular pathology of neuropsychiatric disorders across different ethnic populations.Neurosci Biobehav Rev. 2019 Jul;102:195-207. doi: 10.1016/j.neubiorev.2019.04.015. Epub 2019 Apr 24. Neurosci Biobehav Rev. 2019. PMID: 31028758 Free PMC article. Review.
-
Gene expression profiling in the post-mortem human brain--no cause for dismay.J Chem Neuroanat. 2001 Jul;22(1-2):79-94. doi: 10.1016/s0891-0618(01)00099-0. J Chem Neuroanat. 2001. PMID: 11470556 Review.
Cited by
-
Transcriptomic Characterization of the Human Habenula Highlights Drug Metabolism and the Neuroimmune System.Front Neurosci. 2018 Oct 31;12:742. doi: 10.3389/fnins.2018.00742. eCollection 2018. Front Neurosci. 2018. PMID: 30429765 Free PMC article.
-
A FreeSurfer view of the cortical transcriptome generated from the Allen Human Brain Atlas.Front Neurosci. 2015 Sep 16;9:323. doi: 10.3389/fnins.2015.00323. eCollection 2015. Front Neurosci. 2015. PMID: 26441498 Free PMC article. No abstract available.
-
Transcriptomic characterization of MRI contrast with focus on the T1-w/T2-w ratio in the cerebral cortex.Neuroimage. 2018 Jul 1;174:504-517. doi: 10.1016/j.neuroimage.2018.03.027. Epub 2018 Mar 20. Neuroimage. 2018. PMID: 29567503 Free PMC article.
-
Meta-analysis of sex differences in gene expression in schizophrenia.BMC Syst Biol. 2016 Jan 11;10 Suppl 1(Suppl 1):9. doi: 10.1186/s12918-015-0250-3. BMC Syst Biol. 2016. PMID: 26818902 Free PMC article.
-
The gene expression patterns as surrogate indices of pH in the brain.Front Psychiatry. 2023 May 2;14:1151480. doi: 10.3389/fpsyt.2023.1151480. eCollection 2023. Front Psychiatry. 2023. PMID: 37200901 Free PMC article.
References
-
- Ashburner M, Ball CA, Blake JA, Botstein D, Butler H, Cherry JM, Davis AP, Dolinski K, Dwight SS, Eppig JT, Harris MA, Hill DP, Issel-Tarver L, Kasarskis A, Lewis S, Matese JC, Richardson JE, Ringwald M, Rubin GM, Sherlock G. Gene ontology: tool for the unification of biology. The Gene Ontology Consortium. Nat Genet. 2000;25:25–29. - PMC - PubMed
-
- Bartke A. Impact of reduced insulin-like growth factor-1/insulin signaling on aging in mammals: novel findings. Aging Cell. 2008;7:285–290. - PubMed
Publication types
MeSH terms
Grants and funding
LinkOut - more resources
Full Text Sources
