. 2010 May 15;51(1):63-75.
doi: 10.1016/j.neuroimage.2010.01.104. Epub 2010 Feb 6.

Mapping Alzheimer's disease progression in 1309 MRI scans: power estimates for different inter-scan intervals

Affiliations

Mapping Alzheimer's disease progression in 1309 MRI scans: power estimates for different inter-scan intervals

Xue Hua et al. Neuroimage. .

Abstract

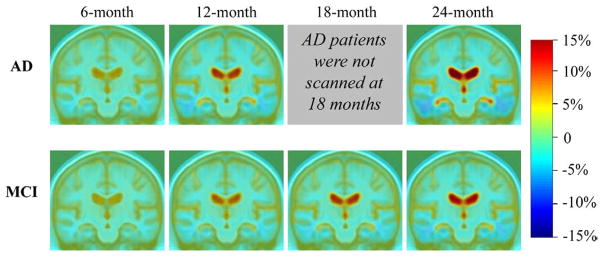
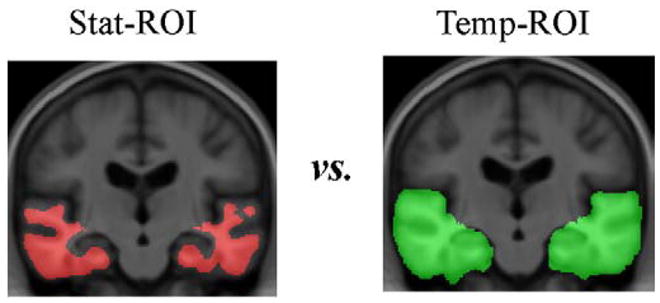
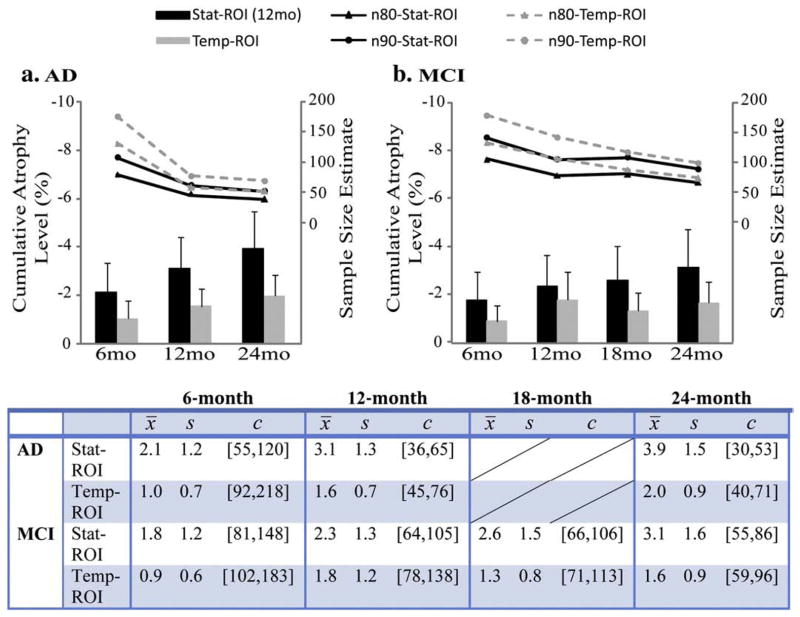
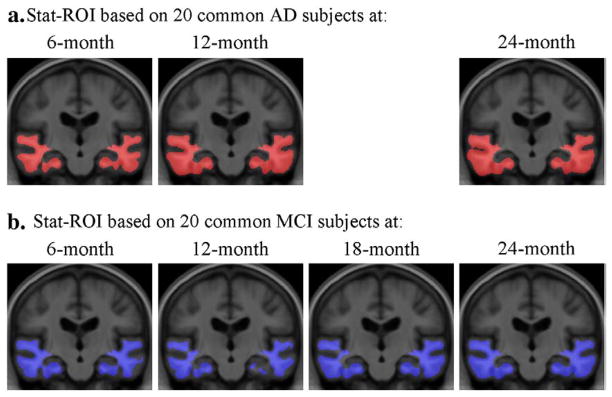
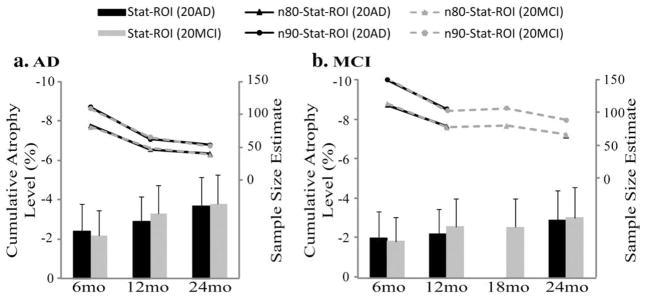
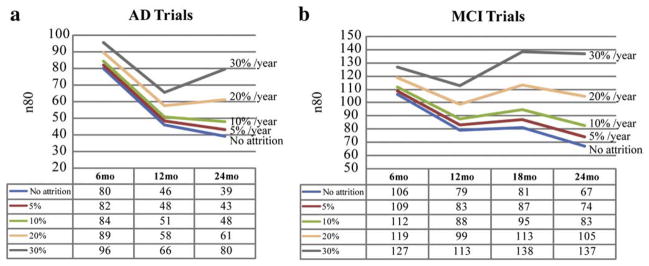
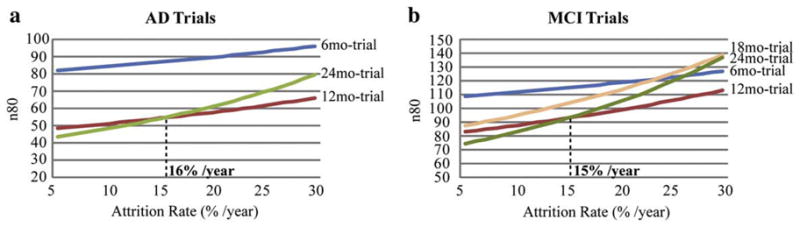
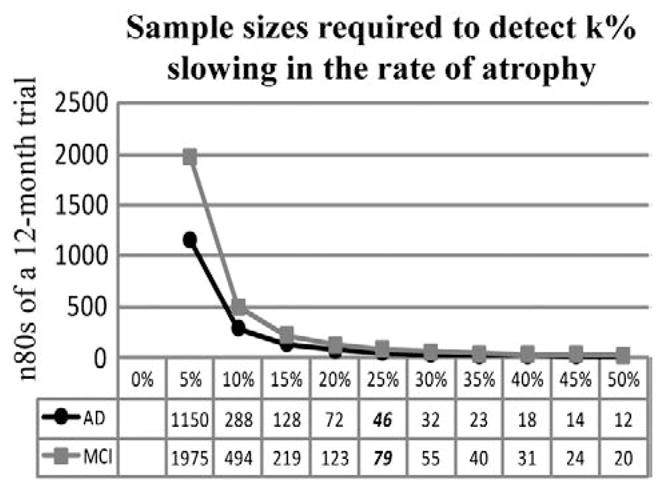
Neuroimaging centers and pharmaceutical companies are working together to evaluate treatments that might slow the progression of Alzheimer's disease (AD), a common but devastating late-life neuropathology. Recently, automated brain mapping methods, such as tensor-based morphometry (TBM) of structural MRI, have outperformed cognitive measures in their precision and power to track disease progression, greatly reducing sample size estimates for drug trials. In the largest TBM study to date, we studied how sample size estimates for tracking structural brain changes depend on the time interval between the scans (6-24 months). We analyzed 1309 brain scans from 91 probable AD patients (age at baseline: 75.4+/-7.5 years) and 189 individuals with mild cognitive impairment (MCI; 74.6+/-7.1 years), scanned at baseline, 6, 12, 18, and 24 months. Statistical maps revealed 3D patterns of brain atrophy at each follow-up scan relative to the baseline; numerical summaries were used to quantify temporal lobe atrophy within a statistically-defined region-of-interest. Power analyses revealed superior sample size estimates over traditional clinical measures. Only 80, 46, and 39 AD patients were required for a hypothetical clinical trial, at 6, 12, and 24 months respectively, to detect a 25% reduction in average change using a two-sided test (alpha=0.05, power=80%). Correspondingly, 106, 79, and 67 subjects were needed for an equivalent MCI trial aiming for earlier intervention. A 24-month trial provides most power, except when patient attrition exceeds 15-16%/year, in which case a 12-month trial is optimal. These statistics may facilitate clinical trial design using voxel-based brain mapping methods such as TBM.


Figures

Fig. 1
Fig. 1
Mean level of progressive atrophy in AD and MCI groups after intervals of 6, 12, 18, and 24 months, respectively. Per the study design, AD patients were not scanned at the 18-month follow-up interval. Clearly, the profile of atrophy, and group differences, are easier to distinguish at later time points. Also, as expected, and as previously reported for 1-year follow-up only (Hua et al., 2009a; Ho et al., in press; Leow et al., 2009), the MCI mean atrophic rate is lower than that seen in AD, at every time-point.
Fig. 2
Fig. 2
Statistically defined regions of interest (Stat-ROI) and temporal lobe regions of interest (Temp-ROI) are shown. The Stat-ROI (left, shown in red) was defined based on voxels that had showed significant atrophic rates over time (p < 0.001) within the temporal lobes, in a non-overlapping training set of 20 AD patients (age at baseline: 74.8±6.3 years; 7 men and 13 women) scanned at baseline and 12-month, chosen outside the independent evaluation set. The Temp-ROI (right, shown in green), including the temporal lobes of both brain hemispheres, was manually delineated on the MDT template by a trained anatomist using the Brainsuite software program (Shattuck and Leahy, 2002). (For interpretation of the references to colour in this figure legend, the reader is referred to the web version of this article.)
Fig. 3
Fig. 3
Average level of cumulative temporal lobe atrophy (as a % of the baseline tissue volume) and sample size estimates required to detect a 25% slowing of degeneration with 80% (n80) and 90% (n90) power, with an observation time of 6, 12, and 24 months for AD (a) and 6, 12, 18, and 24 months for MCI (b). The table shows numerical values of the cumulative atrophy, in percent, as a mean loss (, the sign is omitted here) and standard deviation (s). The 95% confidence interval (c) for the n80 sample size measure was estimated from 10,000 bootstrapped samples. At 6 months, the required sample sizes are much higher than those that would be needed at later time points. Sample size estimates are generally better (i.e., lower) for numeric summaries derived from a statistically pre-defined region of interest (solid black lines) versus an atlas-defined region of interest that covers the entire temporal lobes (dashed gray lines). Also, the degree to which a 6-month interval inflates the sample size estimate is not so extreme for the statistical region of interest, as it focuses on regions where changes are likely to be occurring at this very short follow-up interval.
Fig. 4
Fig. 4
Statistically pre-defined ROIs based on 20 AD patients (a) and 20 MCI subjects (b) chosen from the common set, at a follow-up period of 6, 12, 18, and 24 months. AD patients were not scanned at 18 months so no Stat-ROI was created at that time-point.
Fig. 5
Fig. 5
Average level of cumulative atrophy in the temporal lobes (as a % of baseline tissue volume) and sample size estimates required to detect a 25% slowing of degeneration with 80% (n80) and 90% (n90) power, with an observation time of 6, 12, and 24 months for AD (a) and 6, 12, 18, and 24 months for MCI (b), using various Stat-ROIs. The Stat-ROIs were either based on 20 AD patients (“Stat-ROI (20AD)”) or 20 MCI subjects (“Stat-ROI (20MCI)”) chosen from the common set, at each follow-up interval. In AD, sample size estimates using AD-specific ROIs (data points connected with solid black lines) were almost identical to the ones using an MCI-based ROI (data points connected with dashed gray lines). The same was true for the MCI group, as the gray (MCI-based ROI) and black (AD-based ROI) points mostly overlapped. In other words, it does not matter greatly which group the statistical ROI is generated from.
Fig. 6
Fig. 6
Sample size estimates after adjusting for attrition rate in AD (a) and MCI (b) trials. The sample size estimates with attrition rates of 0%, 5%, 10%, 20% and 30% per year are plotted and summarized in tables. When all patients remain in a trial, i.e., no attrition, longer trials give better power or lower sample size estimates compared to shorter trials. As the attrition rate goes up, shorter trials, particularly the 12-month trial, become the optimal trial duration.
Fig. 7
Fig. 7
Finding the optimal trial duration by plotting the adjusted power estimates (i.e., minimal sample sizes; n80s) against attrition rate in AD (a) and MCI (trials). When the attrition rate is below 16% in AD trials and 15% in MCI trials, a 24-month trial is best; if the attrition rate falls below the cut-off points mentioned above, then a 12-month trial is best, as demonstrated by smaller sample size estimates.
Fig. 8
Fig. 8
Sample sizes required to detect different degrees (k%) of slowing in the rate of atrophy show a quadratic dependency, for a hypothetical 12-month clinical trial using numerical summaries derived from a Stat-ROI. Our sample size estimates (n80AD =46; n80MCI =79 at 12 months) are based on assuming a 25% slowing of the rate of atrophy, whereas in reality, treatments may slow atrophy to different degrees. Even so, the sample size estimates required to detect a k% slowing of atrophy can be easily derived by multiplying the numbers in this paper by (25/k)2.

Comment in

Similar articles

Cited by

References

    1. Aganj I, Sapiro G, Parikshak N, Madsen SK, Thompson PM. Measurement of cortical thickness from MRI by minimum line integrals on soft-classified tissue. Hum Brain Mapp. 2009;30:3188–3199. - PMC - PubMed
    1. Agosta F, Rocca MA, Pagani E, Absinta M, Magnani G, Marcone A, Falautano M, Comi G, Gorno-Tempini ML, Filippi M. Sensorimotor network rewiring in mild cognitive impairment and Alzheimer’s disease. Hum Brain Mapp 2009 - PMC - PubMed
    1. Apostolova LG, Thompson PM. Mapping progressive brain structural changes in early Alzheimer’s disease and mild cognitive impairment. Neuropsychologia. 2008;46:1597–1612. - PMC - PubMed
    1. Apostolova LG, Dutton RA, Dinov ID, Hayashi KM, Toga AW, Cummings JL, Thompson PM. Conversion of mild cognitive impairment to Alzheimer disease predicted by hippocampal atrophy maps. Arch Neurol. 2006;63:693–699. - PubMed
    1. Apostolova LG, Steiner CA, Akopyan GG, Dutton RA, Hayashi KM, Toga AW, Cummings JL, Thompson PM. Three-dimensional gray matter atrophy mapping in mild cognitive impairment and mild Alzheimer disease. Arch Neurol. 2007;64:1489–1495. - PMC - PubMed

Publication types