. 2010 Apr 23;285(17):12670-83.
doi: 10.1074/jbc.M109.063966. Epub 2010 Feb 5.

Down-regulation of MyoD by calpain 3 promotes generation of reserve cells in C2C12 myoblasts

Affiliations

Down-regulation of MyoD by calpain 3 promotes generation of reserve cells in C2C12 myoblasts

Pascal Stuelsatz et al. J Biol Chem. .

Abstract

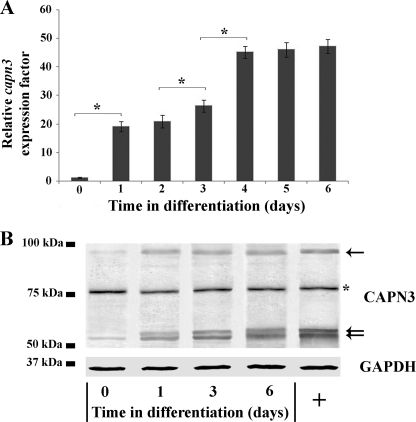
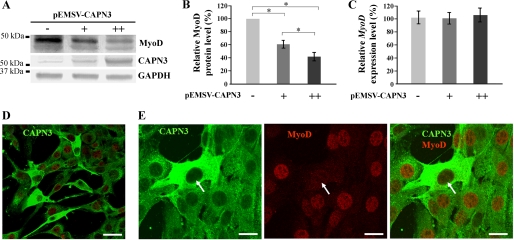
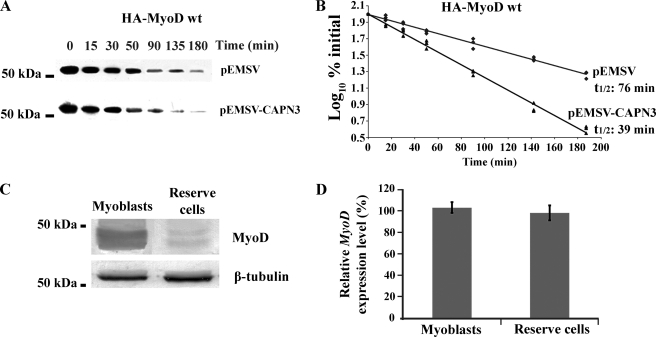
Calpain 3 is a calcium-dependent cysteine protease that is primarily expressed in skeletal muscle and is implicated in limb girdle muscular dystrophy type 2A. To date, its best characterized function is located within the sarcomere, but this protease is found in other cellular compartments, which suggests that it exerts multiple roles. Here, we present evidence that calpain 3 is involved in the myogenic differentiation process. In the course of in vitro culture of myoblasts to fully differentiated myotubes, a population of quiescent undifferentiated "reserve cells" are maintained. These reserve cells are closely related to satellite cells responsible for adult muscle regeneration. In the present work, we observe that reserve cells express higher levels of endogenous Capn3 mRNA than proliferating myoblasts. We show that calpain 3 participates in the establishment of the pool of reserve cells by decreasing the transcriptional activity of the key myogenic regulator MyoD via proteolysis independently of the ubiquitin-proteasome degradation pathway. Our results identify calpain 3 as a potential new player in the muscular regeneration process by promoting renewal of the satellite cell compartment.


Figures

FIGURE 1.
FIGURE 1.
Endogenous expression of Capn3 during myogenic differentiation of C2C12 cells. A, proliferating (day 0) and differentiating C2C12 cells maintained in differentiation for various lengths of time (days 1–6) were harvested, and total RNA was extracted. The expression level of Capn3 was determined by qRT-PCR, as described under “Experimental Procedures.” Relative Capn3 expression is expressed so that 1 represents the Capn3 expression level at day 0 (proliferation). Data are presented as mean ± S.D. (n = 3). Asterisks indicate data that are significantly different according to the ANOVA test for p < 0.05. B, proliferating (day 0) and differentiating C2C12 cells maintained in differentiation for various times (days 1–6) were harvested, and total cell extracts were prepared. 40 μg of cell extract was analyzed by SDS-PAGE and immunoblotting with antibodies specific for calpain 3 and GAPDH. In our experiments, calpain 3 protein is visualized in Western blot as three major specific bands (black arrows): one band at 94 kDa corresponding to the full-length protein and two autoproteolytic products between 60 and 55 kDa corresponding to the autolyzed and active forms of the protease (fragments IS1-Cter). The asterisk indicates a nonspecific band around 75 kDa, which could correspond to the ubiquitous calpains 1 and 2 (71). Specificity of the calpain 3 antibody used has been evaluated by the comparison of Western blot profiles that we obtained with calpain 3-overexpressing cells (right lane, +) and control cells.
FIGURE 2.
FIGURE 2.
Effect of calpain 3 on myogenic differentiation of C2C12 cells. A–F, C2C12 cells were transfected with plasmid encoding calpain 3 (pEMSV-CAPN3) or a pool of three Capn3 siRNAs (siRNApool-CAPN3) and the respective negative controls that are the empty corresponding vector pEMSV and nonspecific siRNA controls (siRNA negative control). A and E, phase-contrast microscopy images were taken and compared after 6 days of differentiation. Two independent experiments were performed, and about 10 images were compared in each experiment and for each condition. Scale bars, 50 μm. B and F, the effects of calpain 3 overexpression (B) and Capn3 knockdown (F) were evaluated by analyzing the fusion curves obtained as described under “Experimental Procedures.” The slopes of fusion curves were determined by the tangential at the C50 point, when 50% of the myotubes were formed. Fusion curves were obtained from three independent experiments. C, differentiation was induced 24 h after transfection, and cells were harvested at different times, as indicated in the figures. J1, J3, and J4, and total cell extract were prepared and analyzed by SDS-PAGE and immunoblotting with antibodies specific for myosin heavy chain (MHC) and myogenin, which serve as differentiation markers of the myogenic lineage, and β-tubulin, which serves as a control. D, relative amounts of the studied proteins were expressed such that 100% is the protein amount in control cells at day 3. All values were normalized with regard to the β-tubulin protein level (n = 3). Asterisks indicate data that are significantly different from control cells by Student's t test, with p values of <0.05 determining statistical significance.
FIGURE 3.
FIGURE 3.
Characterization of reserve cells and endogenous expression of Capn3. A, schematic representation of protocol used to study the different subpopulations of C2C12 cells. C2C12 myoblasts, transfected or not, were maintained in proliferation for 24 h. Differentiation was then induced over 4 days, and the populations of myotubes and reserve cells were separated, as described under “Experimental Procedures.” B, 40 μg of total cell extract of each subpopulation (myoblasts, reserve cells, and myotubes), just as reserve cells that had been put back in proliferative medium for 12 h (reserve cells + 12 h), were analyzed by SDS-PAGE and immunoblotting with antibodies specific for MyoD, Pax7, myogenin, and β-tubulin. C and D, the relative endogenous Capn3 and myogenin expression levels were quantified in the three populations by qRT-PCR, as described under “Experimental Procedures.” The relative expression level of Capn3 or myogenin is presented such that 1 indicates the expression level in myoblasts. The data are presented as mean ± S.D. (n = 3). The single asterisks indicate data that are significantly different according to an ANOVA test for p < 0.05.
FIGURE 4.
FIGURE 4.
Effect of calpain 3 on the apparition of reserve cells during C2C12 differentiation. A and B, C2C12 cells were transfected with plasmid encoding calpain 3 (pEMSV-CAPN3) or a pool of three Capn3 siRNAs (siRNApool-CAPN3) and the respective negative controls. After 4 days of differentiation, reserve cells were isolated and counted with a hemocytometer. Data were analyzed using a box plot graph (n = 3). The double asterisks indicate data that are significantly different according to the Kruskal-Wallis test for p < 0.05.
FIGURE 5.
FIGURE 5.
Transcriptional analysis of Capn3 expression level after ectopic up- or down-regulation. A and B, for each subpopulation (i.e. myoblasts, myotubes, and reserve cells) obtained as described in Fig. 3A, the relative mRNA level of Capn3, as quantified by qRT-PCR, was compared between cells in which Capn3 expression had been up-regulated (A) or down-regulated (B) and the respective control cells. For each subpopulation, the -fold induction or repression was expressed such that endogenous Capn3 expression level measured in respective controls cells was 1. In overexpression experiments (A), the -fold induction in myotubes, myoblasts, and reserve cells was 13.2 ± 0.62, 27 ± 2.1, and 68.2 ± 2.2, respectively. In down-regulation experiments (B), the -fold repression in myotubes, myoblasts, and reserve cells was 12.4 ± 0.63, 4.2 ± 0.21, and 1.2 ± 0.25, respectively. The data are presented as mean ± S.D. (n = 3). The asterisks indicate data that are significantly different according to an ANOVA test for p < 0.05. C, C2C12 cells were co-transfected with pEMSV-CAPN3 and a plasmid encoding a reporter gene (eGFP). At 24 h after transfection, C2C12 cells were induced to differentiate over 4 days and observed by fluorescent microscopy in order to visualize the eGFP protein. D, the same experiment was repeated using cells that had been transfected with only pcDNA3.1-eGFP. The images shown in C have been intentionally selected in order to show the same number of myotubes with respect to the control experiment (D). Four independent experiments were performed, and about 20 images were compared in each experiment and for each condition (C and D). Scale bars, 50 μm.
FIGURE 6.
FIGURE 6.
Effect of calpain 3 on the MRFs. A, C3H10T1/2 cells were transfected with a plasmid encoding one of the four MRFs (pEMSV-Myf5, pEMSV-MRF4, pEMSV-myogenin, or pEMSV-MyoD) by itself or along with pEMSV-CAPN3. Cells were maintained in proliferation medium for 24 h before being harvested. Total cell extract was prepared, and 40 μg was analyzed by SDS-PAGE and immunoblotting with antibodies specific for MyoD, Myf5, MRF4, myogenin, and β-tubulin. B–E, the transcriptional activity of each MRF was measured by analysis of MCK promoter-driven expression of luciferase. At 48 h after transfection, the C3H10T1/2 cells were harvested, and transactivation of the reporter gene was determined by a luciferase assay, as described under “Experimental Procedures.” Luciferase activity is expressed such that 100% indicates the maximum activity measured for each MRF tested without calpain 3. F and G, the transcriptional activity of MyoD was measured by use of a skeletal muscle reporter gene (CAT) under the control of a minimal promoter consisting of four repeats of the E-box element. At 48 h after transfection, the C3H10T1/2 cells were harvested, and transactivation of the reporter gene was determined by a CAT-ELISA assay, as described under “Experimental Procedures.” The amount of CAT is expressed such that 100% indicates the maximum value measured for MyoD without calpain 3. The MRFs and calpain 3 expression plasmids that were transiently transfected into the fibroblast cells (C3H10T1/2) are indicated below the graphs, and +, ++, and +++ indicate the relative amount of plasmid DNA used. The data represent mean ± S.D. (n = 3). The asterisks indicate data that are significantly different according to an ANOVA test for p < 0.05.
FIGURE 7.
FIGURE 7.
Effect of calpain 3 on myogenic conversion of fibroblastic cells induced by ectopic expression of MyoD. A–D, C3H10T1/2 cells were transfected with a plasmid encoding MyoD (pEMSV-MyoD) by itself (control cells) or along with pEMSV-CAPN3. Cells were maintained in proliferation medium for 24 h before inducing differentiation. A and B, after 5 days of differentiation, the cells were harvested, and 40 μg of total extract was analyzed by SDS-PAGE and immunoblotting with antibodies specific for MyoD, myogenin, and GAPDH. All values were normalized to GAPDH protein expression level. Relative protein levels are expressed such that 100% indicates the protein amount in control cells. The data are presented as mean ± S.D. (n = 3). The asterisks indicate data that are significantly different according to Student's test for p < 0.05. C and D, at 24 h after transfection, cells were observed by phase-contrast microscopy. This experiment was repeated three times, and representative images are shown of 20 images captured per experiment. Scale bars, 50 μm.
FIGURE 8.
FIGURE 8.
Calpain 3 specifically induces a decrease in the protein level of endogenous MyoD in C2C12 cells. A–E, C2C12 proliferating myoblasts were transfected with either plasmid encoding calpain 3 (pEMSV-CAPN3) or the corresponding empty vector (pEMSV) as control cells. Cells were maintained in proliferation for 24 h and then induced to differentiate before being harvested 24 h later. A and B, total cell extract was prepared, and 40 μg was analyzed by SDS-PAGE and immunoblotting with antibodies specific for MyoD, calpain 3, and GAPDH. All values are normalized to the GAPDH protein level. The relative amount of MyoD protein is expressed such that 100% indicates the protein amount of MyoD in control cells. The data are presented as the mean ± S.D. (n = 6), and asterisks indicate data that are significantly different according to Student's test for p < 0.05. C, the relative MyoD mRNA level was quantified by qRT-PCR, as described under “Experimental Procedures.” The relative expression level of MyoD is expressed such that 100% represents the expression level in control cells. The data are presented as mean ± S.D. (n = 6). D, calpain 3 is visualized by confocal microscopy following immunostaining, as described under “Experimental Procedures.” Cells that effectively overexpress calpain 3 are easily distinguishable (highly green-staining cells) among the total population of transiently transfected C2C12 cells. Scale bar, 50 μm. E, the cellular amount and localization of calpain 3 and endogenous MyoD were studied by immunocytochemical staining and confocal microscopy, as described under “Experimental Procedures.” The white arrows indicate calpain 3-overexpressing cells. Scale bars, 25 μm.
FIGURE 9.
FIGURE 9.
Study of MyoD degradation by calpain 3. A and B, C2C12 cells were transfected with pcDNA3.1-HA-MyoD WT, encoding wild type HA-MyoD protein, alone or together with pEMSV-CAPN3, and the half-life of HA-MyoD WT was determined following cycloheximide treatment, as described under “Experimental Procedures.” A, total cell extract was prepared at the indicated times, and 40 μg of extract was analyzed by SDS-PAGE and immunoblotting with antibodies specific for HA and GAPDH. B, HA-MyoD WT protein levels, corrected with respect to GAPDH expression, are expressed such that 100% indicates the protein amount before cycloheximide treatment (t0). For each time point, the log10 of the percentage of pixels (y) is plotted versus the time in minutes (x). The half-life (t½) is determined from the log10 of 50% from the linear regression of three independent experiments (regression equations in the absence or in the presence of calpain 3 overexpression are as follows y = −0.00390x + 1.99712 with R2 = 0.98, and y = −0.00772x + 2.00301 with R2 = 0.99, respectively). C and D, the protein and mRNA expression levels of endogenous MyoD were compared in myoblasts and in reserve cells. C, total cell extract was prepared, and 40 μg was analyzed by SDS-PAGE and immunoblotting with antibodies specific for MyoD and β-tubulin (n = 3). D, the relative mRNA level of MyoD was quantified by qRT-PCR, as described under “Experimental Procedures.” The relative expression level of MyoD is expressed such that 100% represents the expression level in myoblasts. The data are presented as mean ± S.D. (n = 3). The asterisks indicate data that are significantly different according to an ANOVA test for p < 0.05.
FIGURE 10.
FIGURE 10.
Study of post-translational modifications and degradation of MyoD by the ubiquitin-proteasome pathway. A–D, C2C12 cells were transfected with plasmid encoding different forms of HA-MyoD protein harboring point mutations (18, 47), with or without pEMSV-CAPN3. A, at 48 h after transfection, cells were harvested, and total cell extract was prepared. 40 μg of cell extract was analyzed by SDS-PAGE and immunoblotting with antibodies specific for HA and GAPDH. B, the relative amount of each HA-MyoD protein, corrected with respect to GAPDH expression, is expressed such that 100% indicates the protein amount of each form of HA-MyoD expressed alone (control cells). The data are presented as mean ± S.D. (n = 3), and asterisks indicate data that are significantly different from control cells according to Student's test for p < 0.05. C and D, the half-life of HA-MyoD K133R was determined following cycloheximide treatment, as described under “Experimental Procedures.” C, total cell extract was prepared at the indicated times, and 40 μg of extract was analyzed by SDS-PAGE and immunoblotting with antibodies specific for HA and GAPDH. D, HA-MyoD K133R protein levels, corrected with respect to GAPDH expression, are expressed such that 100% indicates the protein amount before cycloheximide treatment (t0). For each time point, the log10 of the percentage of pixels (y) is plotted versus the time in minutes (x). The half-life (t½) is determined from the log10 of 50% from the linear regression of three independent experiments (regression equations in the absence or in presence of calpain 3 overexpression are as follows, y = −0.00137x + 1.94542 with R2 = 0.84, and y = −0.00300x + 1.94914 with R2 = 0.94, respectively).

Similar articles

Cited by

References

    1. Hawke T. J., Garry D. J. (2001) J. Appl. Physiol. 91, 534–551 - PubMed
    1. Cooper R. N., Tajbakhsh S., Mouly V., Cossu G., Buckingham M., Butler-Browne G. S. (1999) J. Cell Sci. 112, 2895–2901 - PubMed
    1. Cornelison D. D., Wold B. J. (1997) Dev. Biol. 191, 270–283 - PubMed
    1. Smith C. K., 2nd, Janney M. J., Allen R. E. (1994) J. Cell. Physiol. 159, 379–385 - PubMed
    1. Baroffio A., Bochaton-Piallat M. L., Gabbiani G., Bader C. R. (1995) Differentiation 59, 259–268 - PubMed

Publication types

MeSH terms