

Time scale and adjusted survival curves for marginal structural cox models
- PMID: 20139124
- PMCID: PMC2877453
- DOI: 10.1093/aje/kwp418
Time scale and adjusted survival curves for marginal structural cox models
Abstract
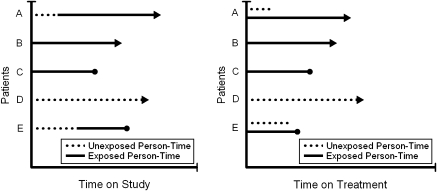
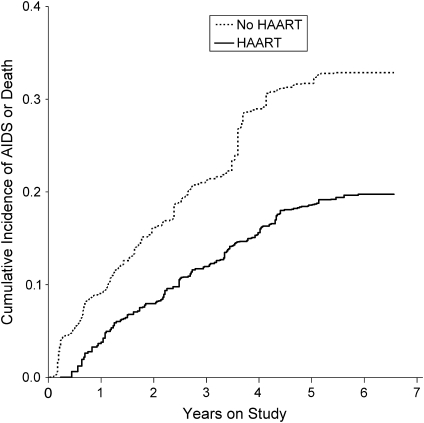
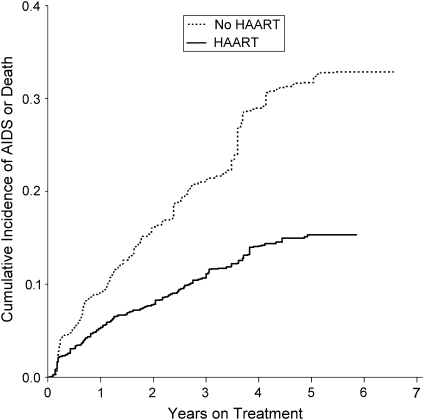
Typical applications of marginal structural time-to-event (e.g., Cox) models have used time on study as the time scale. Here, the authors illustrate use of time on treatment as an alternative time scale. In addition, a method is provided for estimating Kaplan-Meier-type survival curves for marginal structural models. For illustration, the authors estimate the total effect of highly active antiretroviral therapy on time to acquired immunodeficiency syndrome (AIDS) or death in 1,498 US men and women infected with human immunodeficiency virus and followed for 6,556 person-years between 1995 and 2002; 323 incident cases of clinical AIDS and 59 deaths occurred. Of the remaining 1,116 participants, 77% were still under observation at the end of follow-up. By using time on study, the hazard ratio for AIDS or death comparing always with never using highly active antiretroviral therapy from the marginal structural model was 0.52 (95% confidence interval: 0.35, 0.76). By using time on treatment, the analogous hazard ratio was 0.44 (95% confidence interval: 0.32, 0.60). In time-to-event analyses, the choice of time scale may have a meaningful impact on estimates of association and precision. In the present example, use of time on treatment yielded a hazard ratio further from the null and more precise than use of time on study as the time scale.
Figures
References
-
- Klein JP, Moeschberger ML. Survival Analysis: Techniques for Censored and Truncated Data. New York, NY: Springer; 2003.
-
- Korn EL, Graubard BI, Midthune D. Time-to-event analysis of longitudinal follow-up of a survey: choice of the time-scale. Am J Epidemiol. 1997;145(1):72–80. - PubMed
-
- Lamarca R, Alonso J, Gómez G, et al. Left-truncated data with age as time scale: an alternative for survival analysis in the elderly population. J Gerontol A Biol Sci Med Sci. 1998;53(5):M337–M343. - PubMed
-
- Ray WA. Evaluating medication effects outside of clinical trials: new-user designs. Am J Epidemiol. 2003;158(9):915–920. - PubMed
-
- Robins JM, Hernán MA, Brumback B. Marginal structural models and causal inference in epidemiology. Epidemiology. 2000;11(5):550–560. - PubMed
Publication types
MeSH terms
Grants and funding
- U01 AI037984/AI/NIAID NIH HHS/United States
- UO1-AI-34994/AI/NIAID NIH HHS/United States
- U01 AI031834/AI/NIAID NIH HHS/United States
- UO1-AI-35042/AI/NIAID NIH HHS/United States
- UO1-AI-35040/AI/NIAID NIH HHS/United States
- U01 AI035041/AI/NIAID NIH HHS/United States
- UO1-AI-34993/AI/NIAID NIH HHS/United States
- U01 AI034994/AI/NIAID NIH HHS/United States
- U01 AI035043/AI/NIAID NIH HHS/United States
- U01 AI034993/AI/NIAID NIH HHS/United States
- U01 AI035039/AI/NIAID NIH HHS/United States
- U01 AI035042/AI/NIAID NIH HHS/United States
- UO1-HD-32632/HD/NICHD NIH HHS/United States
- T32 AI007001/AI/NIAID NIH HHS/United States
- UO1-AI-34989/AI/NIAID NIH HHS/United States
- UO1-AI-37984/AI/NIAID NIH HHS/United States
- U01 AI035004/AI/NIAID NIH HHS/United States
- UL1 RR024131/RR/NCRR NIH HHS/United States
- U01 AI034989/AI/NIAID NIH HHS/United States
- T32-AI-07001/AI/NIAID NIH HHS/United States
- U01 AI037613/AI/NIAID NIH HHS/United States
- UO1-AI-35041/AI/NIAID NIH HHS/United States
- R03 AI071763/AI/NIAID NIH HHS/United States
- M01 RR000722/RR/NCRR NIH HHS/United States
- UO1-AI-35004/AI/NIAID NIH HHS/United States
- R03-AI-071763/AI/NIAID NIH HHS/United States
- UO1-AI-35039/AI/NIAID NIH HHS/United States
- R01-AA-01759/AA/NIAAA NIH HHS/United States
- UO1-AI-42590/AI/NIAID NIH HHS/United States
- U01 AI035040/AI/NIAID NIH HHS/United States
- 5-MO1-RR-00722/RR/NCRR NIH HHS/United States
- UO1-AI-31834/AI/NIAID NIH HHS/United States
- UO1-AI-35043/AI/NIAID NIH HHS/United States
- UO1-AI-37613/AI/NIAID NIH HHS/United States
- U01 HD032632/HD/NICHD NIH HHS/United States
- U01 AI042590/AI/NIAID NIH HHS/United States
