Embryo and endosperm inherit distinct chromatin and transcriptional states from the female gametes in Arabidopsis
- PMID: 20139161
- PMCID: PMC2845419
- DOI: 10.1105/tpc.109.071647
Embryo and endosperm inherit distinct chromatin and transcriptional states from the female gametes in Arabidopsis
Abstract
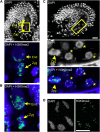
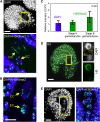
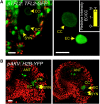
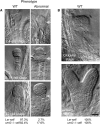
Whether deposited maternal products are important during early seed development in flowering plants remains controversial. Here, we show that RNA interference-mediated downregulation of transcription is deleterious to endosperm development but does not block zygotic divisions. Furthermore, we show that RNA POLYMERASE II is less active in the embryo than in the endosperm. This dimorphic pattern is established late during female gametogenesis and is inherited by the two products of fertilization. This juxtaposition of distinct transcriptional activities correlates with differential patterns of histone H3 lysine 9 dimethylation, LIKE HETEROCHROMATIN PROTEIN1 localization, and Histone H2B turnover in the egg cell versus the central cell. Thus, distinct epigenetic and transcriptional patterns in the embryo and endosperm are already established in their gametic progenitors. We further demonstrate that the non-CG DNA methyltransferase CHROMOMETHYLASE3 (CMT3) and DEMETER-LIKE DNA glycosylases are required for the correct distribution of H3K9 dimethylation in the egg and central cells, respectively, and that plants defective for CMT3 activity show abnormal embryo development. Our results provide evidence that cell-specific mechanisms lead to the differentiation of epigenetically distinct female gametes in Arabidopsis thaliana. They also suggest that the establishment of a quiescent state in the zygote may play a role in the reprogramming of the young plant embryo.
Figures


Comment in
-
Mother knows best: maternal influence on early embryogenesis.Plant Cell. 2010 Feb;22(2):293. doi: 10.1105/tpc.110.220210. Epub 2010 Feb 5. Plant Cell. 2010. PMID: 20139164 Free PMC article. No abstract available.
Similar articles
-
A role for CHROMOMETHYLASE3 in mediating transposon and euchromatin silencing during egg cell reprogramming in Arabidopsis.Plant Signal Behav. 2010 Oct;5(10):1167-70. doi: 10.4161/psb.5.10.11905. Epub 2010 Oct 1. Plant Signal Behav. 2010. PMID: 20505370 Free PMC article.
-
Activation of CYCD7;1 in the central cell and early endosperm overcomes cell-cycle arrest in the Arabidopsis female gametophyte, and promotes early endosperm and embryo development.Plant J. 2015 Oct;84(1):41-55. doi: 10.1111/tpj.12957. Plant J. 2015. PMID: 26261067 Free PMC article.
-
Maternal regulation of seed growth and patterning in flowering plants.Curr Top Dev Biol. 2020;140:257-282. doi: 10.1016/bs.ctdb.2019.10.008. Epub 2019 Nov 19. Curr Top Dev Biol. 2020. PMID: 32591076
-
Transcriptional and hormonal signaling control of Arabidopsis seed development.Curr Opin Plant Biol. 2010 Oct;13(5):611-20. doi: 10.1016/j.pbi.2010.08.009. Epub 2010 Sep 25. Curr Opin Plant Biol. 2010. PMID: 20875768 Review.
-
The long and winding road: transport pathways for amino acids in Arabidopsis seeds.Plant Reprod. 2018 Sep;31(3):253-261. doi: 10.1007/s00497-018-0334-5. Epub 2018 Mar 16. Plant Reprod. 2018. PMID: 29549431 Review.
Cited by
-
The Arabidopsis general transcription factor TFIIB1 (AtTFIIB1) is required for pollen tube growth and endosperm development.J Exp Bot. 2013 May;64(8):2205-18. doi: 10.1093/jxb/ert078. Epub 2013 Apr 1. J Exp Bot. 2013. PMID: 23547107 Free PMC article.
-
Mother knows best: maternal influence on early embryogenesis.Plant Cell. 2010 Feb;22(2):293. doi: 10.1105/tpc.110.220210. Epub 2010 Feb 5. Plant Cell. 2010. PMID: 20139164 Free PMC article. No abstract available.
-
Genomic analysis of parent-of-origin allelic expression in Arabidopsis thaliana seeds.PLoS One. 2011;6(8):e23687. doi: 10.1371/journal.pone.0023687. Epub 2011 Aug 17. PLoS One. 2011. PMID: 21858209 Free PMC article.
-
Inhibition of Histone H3K9 Methylation by BIX-01294 Promotes Stress-Induced Microspore Totipotency and Enhances Embryogenesis Initiation.Front Plant Sci. 2017 Jun 29;8:1161. doi: 10.3389/fpls.2017.01161. eCollection 2017. Front Plant Sci. 2017. PMID: 28706533 Free PMC article.
-
Transcriptional dynamics during karyogamy in rice zygotes.Development. 2025 Jan 15;152(2):DEV204497. doi: 10.1242/dev.204497. Epub 2025 Jan 27. Development. 2025. PMID: 39777484 Free PMC article.
References
-
- Baroux C., Autran D., Gillmor C.S., Grimanelli D., Grossniklaus U. (2008). The maternal-to-zygotic transition in animals and plants. Cold Spring Harb. Symp. Quant. Biol. 73: 89–100 - PubMed
-
- Barski A., Cuddapah S., Cui K., Roh T.Y., Schones D.E., Wang Z., Wei G., Chepelev I., Zhao K. (2007). High-resolution profiling of histone methylations in the human genome. Cell 129: 823–837 - PubMed
-
- Bayer M., Nawy T., Giglione C., Galli M., Meinnel T., Lukowitz W. (2009). Paternal control of embryonic patterning in Arabidopsis thaliana. Science 323: 1485–1488 - PubMed
Publication types
MeSH terms
Substances
Grants and funding
LinkOut - more resources
Full Text Sources
Other Literature Sources
Molecular Biology Databases

