. 2010 Feb 23;107(8):3622-7.
doi: 10.1073/pnas.0914312107. Epub 2010 Feb 5.

Complete HOX cluster characterization of the coelacanth provides further evidence for slow evolution of its genome

Affiliations

Complete HOX cluster characterization of the coelacanth provides further evidence for slow evolution of its genome

Chris T Amemiya et al. Proc Natl Acad Sci U S A. .

Abstract

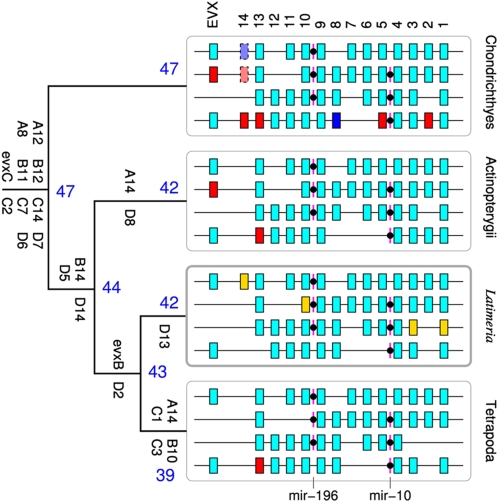
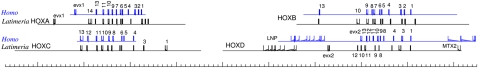
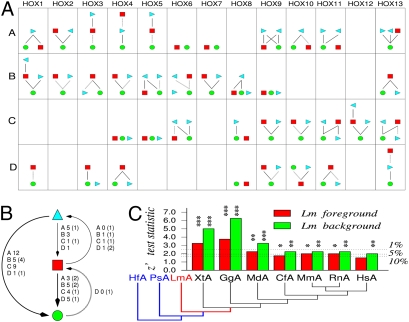
The living coelacanth is a lobe-finned fish that represents an early evolutionary departure from the lineage that led to land vertebrates, and is of extreme interest scientifically. It has changed very little in appearance from fossilized coelacanths of the Cretaceous (150 to 65 million years ago), and is often referred to as a "living fossil." An important general question is whether long-term stasis in morphological evolution is associated with stasis in genome evolution. To this end we have used targeted genome sequencing for acquiring 1,612,752 bp of high quality finished sequence encompassing the four HOX clusters of the Indonesian coelacanth Latimeria menadoensis. Detailed analyses were carried out on genomic structure, gene and repeat contents, conserved noncoding regions, and relative rates of sequence evolution in both coding and noncoding tracts. Our results demonstrate conclusively that the coelacanth HOX clusters are evolving comparatively slowly and that this taxon should serve as a viable outgroup for interpretation of the genomes of tetrapod species.


Conflict of interest statement

The authors declare no conflict of interest.

Figures

Fig. 1.
Fig. 1.
Evolution of the HOX clusters in chordates. For each taxon, HOX clusters are illustrated from top to bottom: HOXA, HOXB, HOXC, and HOXD. Genes shown in cyan are inferred to constitute the ancestral states of the major chordate lineages. Dark blue boxes are losses in the actinopterygian stem linages, red boxes are genes that are absent from Latimeria, and yellow boxes indicate Latimeria genes that are lost in the tetrapod stem-lineage. The number of retained Hox genes is indicated by blue numbers; the gene designations among the branches are those Hox genes inferred to have been lost. Ancestral gene complements are a composite of previous publications (, , –34, 45). Gene counts include Hox pseudogenes but exclude Exv paralogues. Most data from actinopterygian fishes come from teleosts, which have undergone an additional round of genome duplication. A gene is counted as present if it survived in at least one of the two teleostean copies. Duplicated paralogues are not added to the total.
Fig. 2.
Fig. 2.
Scale map of the Latimeria menadoensis HOX clusters compared with their human counterparts (blue). Major tic marks are 100 kb. Comparison of relative HOX cluster sizes and intergenic spacing among various vertebrates is given in Fig. S2.
Fig. 3.
Fig. 3.
Distribution of conserved noncoding DNA in IGRs between Hox genes. The figure summarizes the compilation of the conserved phylogenetic footprints as determined by the tracker algorithm. A listing of all conserved footprints is given online (http://www.bioinf.uni-leipzig.de/Publications/SUPPLEMENTS/09-002/). For each IGR, as well as the regions flanking the four Latimeria HOX clusters, the fraction of nucleotides contained in conserved noncoding elements is plotted. The highest totals are seen between HoxA2 and HoxA3, HoxB2 and HoxB3, HoxC5 and HoxC6, and HoxD3 and HoxD4. Functional aspects of these conserved footprints are largely unknown, although many are likely to represent cis-regulatory elements.
Fig. 4.
Fig. 4.
Density of repetitive elements measured as the fraction of nucleotides annotated as interspersed repeats by repeatmasker. Numbers refer to Hox genes; E, Evx. The fraction of nucleotides in repetitive elements is shown on a log-scale for each IGR and the regions adjacent to the HOX clusters. The three horizontal lines indicate the distribution of the repeat density of the Latimeria genome determined from the 15 longest GenBank entries for Latimeria menadoensis. The middle line is the average density. In addition plus/minus 1 SD is indicated. Repetitive elements are depleted only within the HOX clusters, whereas in the flanking regions the repeat density is consistent with the genomic distribution.
Fig. 5.
Fig. 5.
RRTs: (A) Summary of Tajima tests performed on Hox protein sequences using horn shark (HOXA, HOXB, HOXD) or elephant shark (HOXC) as outgroup. For each gene, a Hasse diagram shows highly significant (P ≤ 0.01, solid line) and significant (0.01 < P ≤ 0.05, dotted line) comparisons, with the faster-evolving gene shown above the slower-evolving one. Lm, circle; Hs, square; Dr-a, right-pointing triangle, Dr-b, left-pointing triangle. (B) Summary of significant relative rate tests at species level. Each arrow indicates that RRTs were significant for one or more genes between two species, with the arrow pointing toward the slower-evolving species. Full arrows imply that there are highly significant test results, dotted arrows refer to tests that are only significant. The number of highly significant (significant) tests is indicated for each of the four HOX clusters. Except for the HOXD cluster, most zebrafish genes (triangles) evolve faster than human genes (squares). For HOXD, this situation is reversed. With a single marginally significant exception (HoxD10), Latimeria (circles) never appears as the faster-evolving species. (C) Relative rate tests for conserved noncoding regions. Two outgroups are necessary to determine the conserved nucleotide positions. The test contrasts the evolutionary rate of one of two ingroups (foreground) against a constant rate among the two outgroups and the other ingroup (background). Latimeria always appears slow evolving: as “foreground” it appears significantly retarded. When used as background ingroup, each tetrapod ingroup is significantly accelerated. Significance levels: *P < 0.1, **P < 0.05, ***P < 0.01. Dr, Danio rerio (zebrafish); Hf, Heterodontus francisci (horn shark); Ps, Polypterus senegalus (bichir); Lm, Latimeria menadoensis (coelacanth); Xt, Xenopus tropicalis (clawed frog); Gg, Gallus gallus (chicken); Md, Monodelphis domestica (opossum); Cf, Canis familiaris (dog); Mm, Mus musculus (mouse); Rn, Rattus norvegicus (rat); Hs, Homo sapiens (human).

References

    1. Balon EK, Bruton MN, Fricke H. A fiftieth anniversary reflection on the living coelacanth, Latimeria chalumnae: some new interpretations of its natural history and conservation status. Environ Biol Fishes. 1988;23:241–280.
    1. Danke J, et al. Genome resource for the indonesian coelacanth, Latimeria menadoensis . J Exp Zoolog A Comp Exp Biol. 2004;301:228–234. - PubMed
    1. Shashikant C, Bolanowski SA, Danke J, Amemiya CT. Hoxc8 early enhancer of the indonesian coelacanth, Latimeria menadoensis . J Exp Zoolog B Mol Dev Evol. 2004;302:557–563. - PubMed
    1. Carroll RL. Vertebrate paleontology and evolution. New York: H. Freeman and Co.; 1988.
    1. Takezaki N, Figueroa F, Zaleska-Rutczynska Z, Takahata N, Klein J. The phylogenetic relationship of tetrapod, coelacanth, and lungfish revealed by the sequences of forty-four nuclear genes. Mol Biol Evol. 2004;21:1512–1524. - PubMed

Publication types

Substances

Associated data

LinkOut - more resources