. 2010 Mar;42(3):216-23.
doi: 10.1038/ng.527. Epub 2010 Feb 7.

Identification of DOK genes as lung tumor suppressors

Affiliations

Identification of DOK genes as lung tumor suppressors

Alice H Berger et al. Nat Genet. 2010 Mar.

Abstract

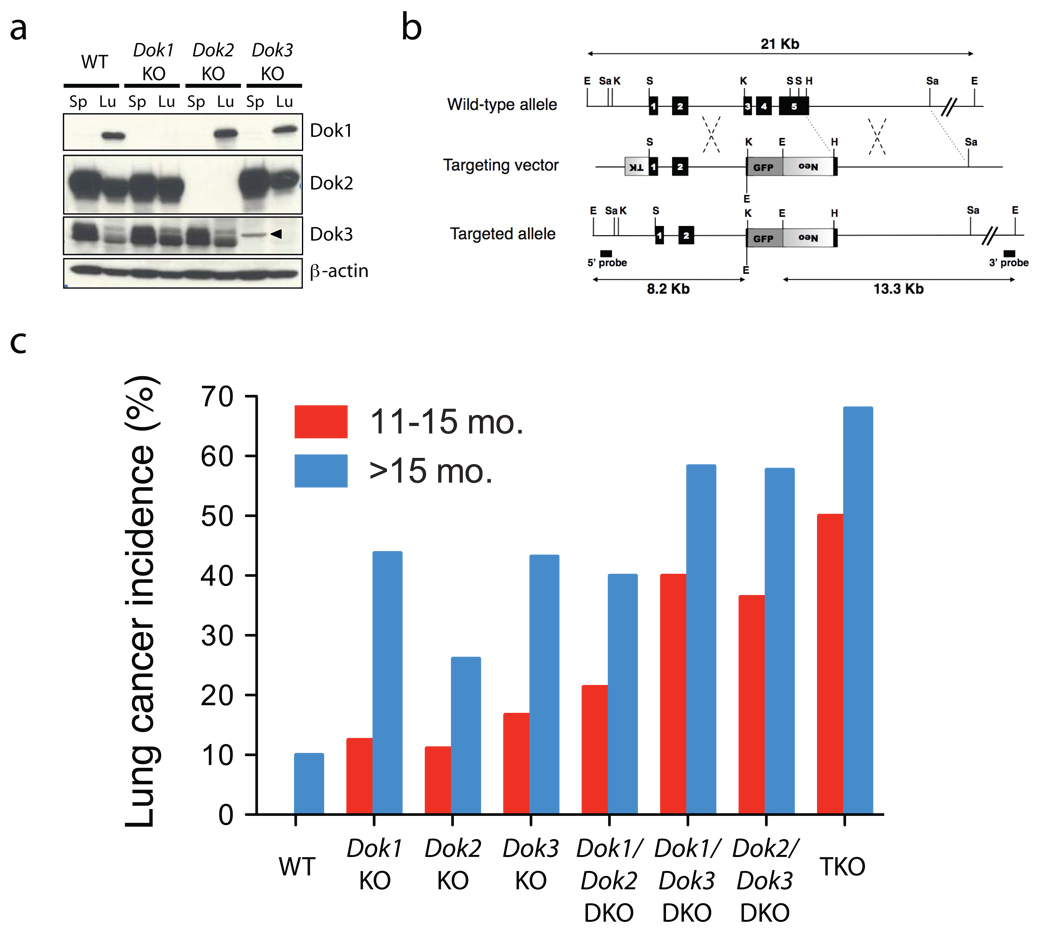
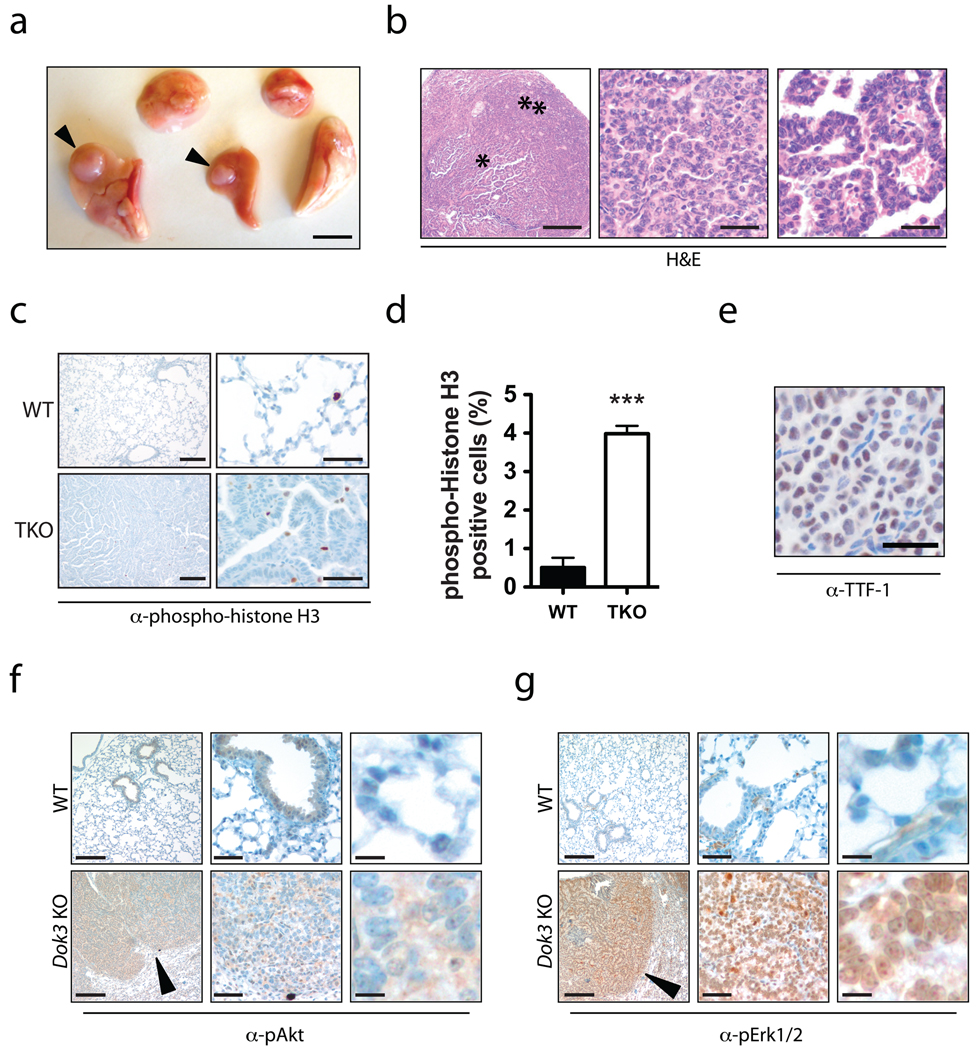
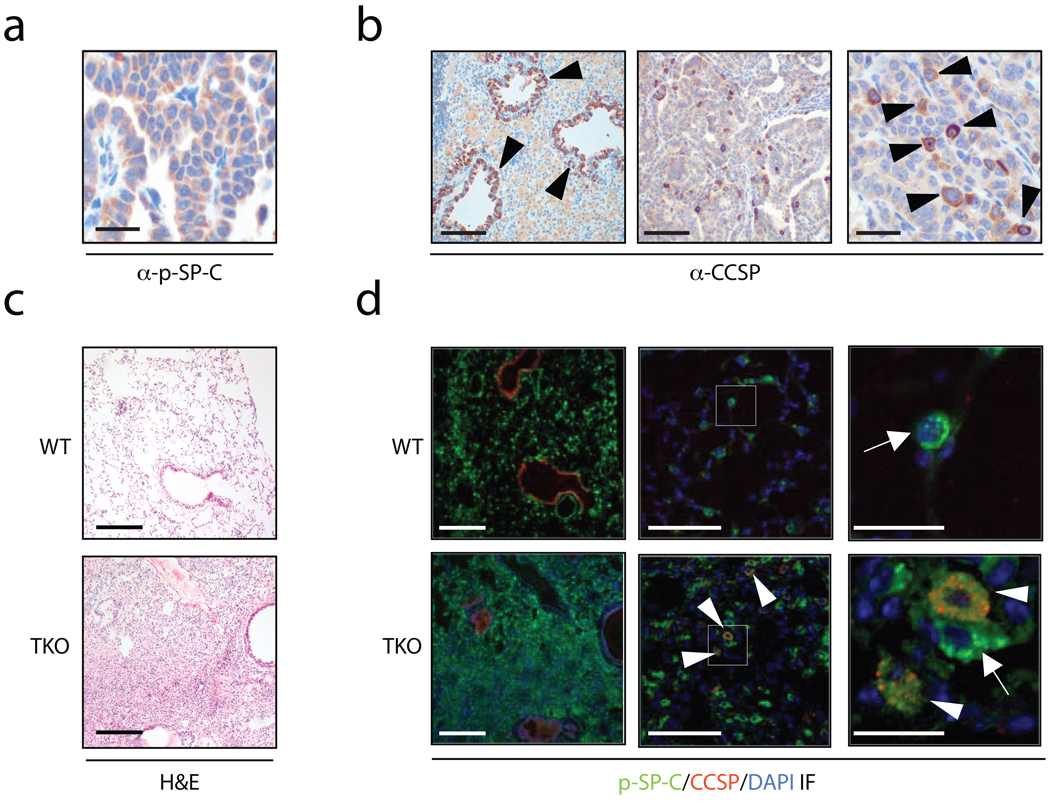
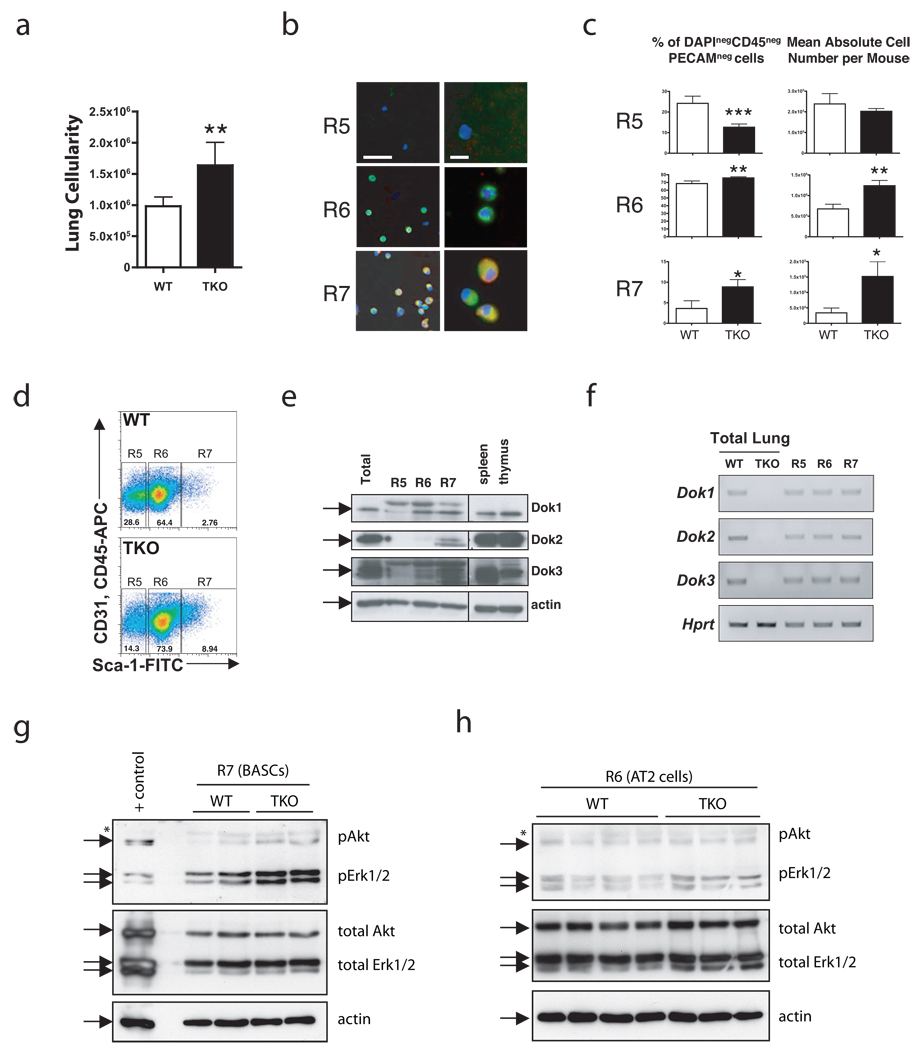
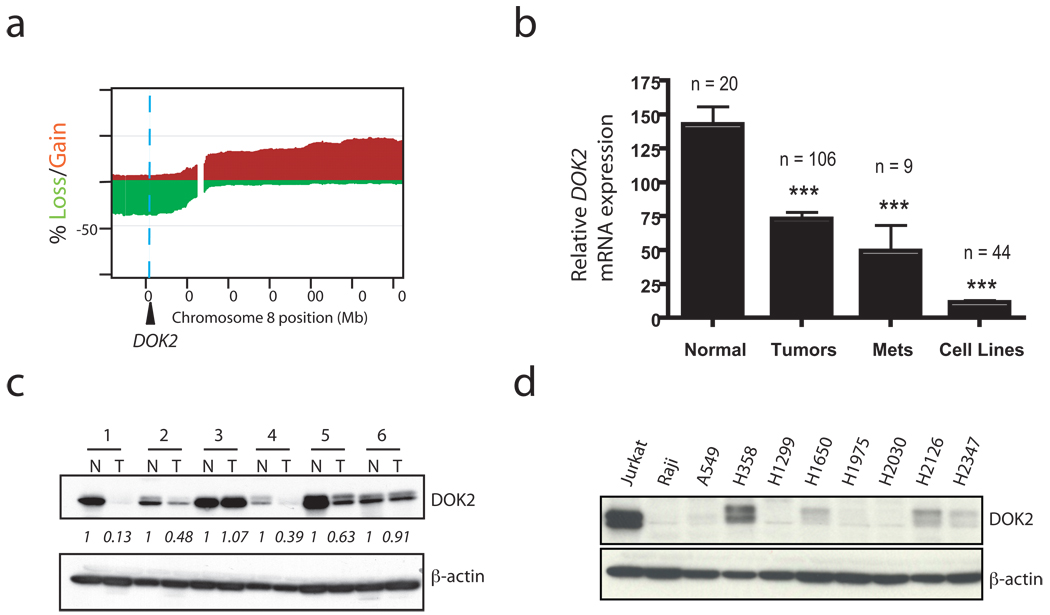
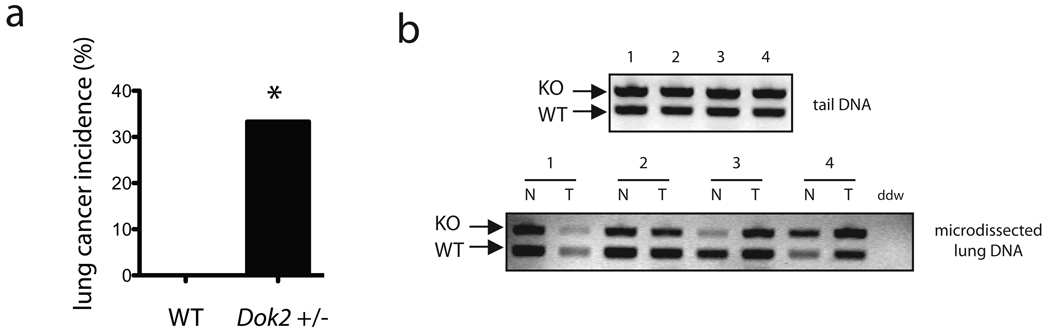
Genome-wide analyses of human lung adenocarcinoma have identified regions of consistent copy-number gain or loss, but in many cases the oncogenes and tumor suppressors presumed to reside in these loci remain to be determined. Here we identify the downstream of tyrosine kinase (Dok) family members Dok1, Dok2 and Dok3 as lung tumor suppressors. Single, double or triple compound loss of these genes in mice results in lung cancer, with penetrance and latency dependent on the number of lost Dok alleles. Cancer development is preceded by an aberrant expansion and signaling profile of alveolar type II cells and bronchioalveolar stem cells. In human lung adenocarcinoma, we identify DOK2 as a target of copy-number loss and mRNA downregulation and find that DOK2 suppresses lung cancer cell proliferation in vitro and in vivo. Given the genomic localization of DOK2, we propose it as an 8p21.3 haploinsufficient human lung tumor suppressor.


Figures

Figure 1
Figure 1. Dok1, Dok2, and Dok3 single and compound KO mice develop lung cancer
(a) Immunoblot analysis of Dok1, Dok2, Dok3 and β-actin (loading control) proteins in cell lysates of splenocytes (Sp) or homogenized whole lung (Lu) from wild-type (WT), Dok1 KO, Dok2 KO, or Dok3 KO mice. An arrowhead indicates a non-specific band. Dok1 was detected in the spleen lysate at a longer exposure (not shown) and in our previously published work. (b) Schematic map of the wild-type Dok3 locus (top), the targeting vector (middle) and the predicted targeted locus (bottom). The Dok3 genomic sequence is depicted as a line with solid boxes representing exons 1 to 5. Sequences from the pPNT plasmid are shown as boxes with lines, with shaded boxes representing the neomycin resistance cassette (neo), the HSV thymidine kinase (TK) cassette, or the GFP expression cassette, as indicated. The Dok3 genomic fragments used as probes for Southern-blot analysis are indicated (5’ probe, 3’ probe), as well as the expected fragments (arrows) following hybridization with the probes after digestion with EcoRI. EcoRI (E), SalI (Sa), HindIII (H), KpnI (K), and SmaI (S) sites are shown. (c) Lung adenocarcinoma incidence in Dok1, Dok2, and Dok3 single, double and triple KO mice. Animal numbers and statistics are summarized in Table 1.
Figure 2
Figure 2. Histopathology of lung tumors in Dok KO mice
(a) Gross view of the five lung lobes from a Dok TKO mouse. Arrowheads indicate tumor nodules. Scale bar, 5 mm. (b) Left, H&E-stained adenocarcinoma with papillary features (star) and solid growth areas (double star) from a Dok2/Dok3 DKO lung. Scale bar, 500 µm. Middle, close-up of solid growth region. Scale bar, 50 µm. Right, close-up of papillary growth region. Scale bar, 50 µm. (c) IHC for phosphohistone H3 (brown) on lung tissue from age-matched wild-type (top panels) or Dok TKO (bottom panels) mice. Left panels, scale bar = 200 µm. Right panels, scale bar = 50 µm. (d) Quantification of phospho-histone H3 IHC shown in (c). Data shown is mean+SEM of three randomly selected tumor or normal fields. ***, P < 0.001 by two-tailed t-test. (e) TTF-1 IHC (brown) of a Dok1/Dok3 DKO lung tumor. Scale bar, 50 µm. (f) IHC for pAkt (Ser473; brown) on wild-type (top panels) or Dok3 KO lung tissue, showing cytoplasmic positivity in the Dok3 KO lung tissue. Left panels, scale bar = 200 µm. Middle panels, scale bar = 50 µm. Right panels, scale bar = 10 µm. An arrowhead indicates positive staining in the lung tumor region. (g) IHC for pErk1/2 (Thr202/Tyr204) in wild-type or Dok3 KO lung tissue showing predominantly nuclear staining. Left panels, scale bar = 200 µm. Middle panels, scale bar = 50 µm. Right panels, scale bar = 10 µm. An arrowhead indicates positive staining in the lung tumor region.
Figure 3
Figure 3. Hyperplasia and tumors in Dok KO mice consist of AT2 cells and BASCs
(a) IHC for the AT2 cell marker pSP-C (brown) in a Dok1/Dok3 DKO tumor. Scale bar, 50 µm. (b) IHC for the Clara cell marker CCSP (brown) in a Dok1/Dok3 DKO tumor. Left panel, arrowheads indicate positive bronchiolar staining. Scale bar, 200 µm. Middle panel, scale bar = 200 µm. Right panel, arrowheads indicate scattered CCSP-positive cells in the tumor area. Scale bar, 50 µm. (c) H&E-staining of wild-type (upper panel) or Dok TKO (lower panel) lung tissue from 12-week old mice. Scale bar, 200 µm. (d) IF for pSP-C (green), CCSP (red), and DAPI (blue) on serial sections to those shown in panel (c). Left panels, scale bar = 200 µm. Middle panels, white boxes indicate the region magnified in the panels to the right. Scale bar, 50 µm. Right panels, close-up of the boxed region shown in the middle panels. Arrows indicate pSP-C+ AT2 cells. Arrowheads indicate pSP-C/CCSP double-positive BASCs. Scale bar, 10 µm.
Figure 4
Figure 4. Lung tumorigenesis in Dok TKO mice is preceded by an expansion of AT2 cells and BASCs
(a) Cellularity of WT and TKO CD45negPECAMneg lung cells after dissociation, counting, and flow cytometry. Data shown is mean+SEM; **, P < 0.01 by two-tailed t-test, n = 5 WT and n = 4 TKO. (b) IF of the indicated populations after FACS. DAPI (blue), pSP-C (green), and CCSP (red). R5: Sca-1negCD45negPecamnegautofllo; R6, AT2 cells: Sca-1negCD45negPecamnegautoflhi; R7, BASCs: Sca-1posCD45negPecamneg. Left, scale bar = 50 µm. Right, scale bar = 10 µm. (c) Summary of percentages (left) and absolute numbers (right) of cell populations from 12-week old WT and TKO mice. Data shown are mean+SEM; *, P < 0.05, **, P < 0.01, ***, P < 0.001 by two-tailed t-test, n = 5 WT and n = 4 TKO. (d) Representative dot plot from flow cytometric analysis of WT and TKO CD45negPECAMneg cell populations using PECAM-APC, CD45-APC, and Sca-1-FITC antibodies. (e) Western blot of sorted cell populations. Cell lysates of splenocytes and thymocytes were used as controls. Arrows indicate Dok1, Dok2, Dok3 or β-actin. (f) RT-PCR of Dok1, Dok2, and Dok3 from WT and TKO unsorted lung, and WT R5, R6, and R7 fractions. Quantitative data is shown in Supplementary Figure 3b. (g) Western blot analysis of BASC lysates from 12-week old mice. 40,000 cells were pooled from 1–3 mice for each lane. Wild-type lung was used as a positive control (+ control). Arrows indicate the bands expected for each protein. A non-specific band is also indicated (*). (h) Western blot analysis of AT2 lysates. Each lane contains a sample from a different animal. Markings are as in (g).
Figure 5
Figure 5. Loss of DOK2 expression in human NSCLC and functional data implicate DOK2 as a human lung tumor suppressor
(a) Frequency of chromosome 8 copy number aberration determined by aCGH analysis of 199 primary human lung adenocarcinoma samples. Shown is the percentage of samples with loss (green) or gain (red) of a particular genomic locus on chromosome 8. Regional gain/loss was defined with a log2 ratio threshold of +/−0.15. A blue dashed line indicates the genomic position of DOK2. (b) DOK2 mRNA expression from a microarray of primary lung adenocarcinoma samples, lymph node metastases, cell lines, or normal lung (control). ***, P < 0.001 by two-tailed t-test. Data shown is mean + SEM. (c) Western blot of DOK2 protein or β-actin (loading control) in paired lysates from primary human lung tumors (T) and adjacent normal lung from the same patients (N). Relative abundance of DOK2 was quantified using ImageJ software. The numbers represent the ratio of DOK2 to actin expression after normalization by setting the value of each N sample to 1. (d) Western blot of DOK2 or β-actin (loading control) in human NSCLC cell lines. Jurkat and Raji cells were used as a positive and negative control, respectively. See Supplementary Figure 5d for the relative expression in these lines compared to normal, primary human lung tissue.
Figure 6
Figure 6. DOK2 suppresses lung cancer cell proliferation in vitro and in vivo
(a) Growth curve analysis of H1299 cells with and without retroviral-mediated overexpression of DOK2. Relative cell number was determined after cell fixation and crystal violet staining using the optical density at 595 nm (OD 595). Triplicate wells were performed and the data shown is mean+SD of a representative experiment. The experiment was repeated five times. A Western blot, inset, confirms expression of DOK2. (b) Analysis of Erk and Akt activation in the same cells used for the experiment in panel (a). Cells were serum starved in medium containing 0.1% FCS for 12 hours, stimulated with 20% FCS for the times indicated (minutes), then lysed and used for Western blot analysis with antibodies against phosphorylated Erk1/2 (pErk) or phosphorylated Akt (pAkt). (c) Tumor volume measurements of tumors formed from subcutaneous injection of H1299 cells with or without DOK2 expression into the flanks of nude mice. The experiment was performed in triplicate and the data shown is mean+SD. A Western blot, inset, confirms expression of DOK2. (d) Picture of tumors formed by H1299 cells with or without expression of DOK2 taken at week 5 after cell injection. An arrowhead indicates the tumor mass in each panel.
Figure 7
Figure 7. Lung tumorigenesis in Dok2 +/− mice
(a) Summary of lung tumor incidence in Dok2 +/− mice (n = 12) and wild-type controls (n = 13) at 15–19 months of age. *, P < 0.05 by two-tailed Fisher’s exact test. (b) PCR analysis of genomic DNA from tail DNA (top panel) or laser capture microdissected-lung cells (bottom panel) in four Dok2 +/− mice (#1–4). Tumor cells (T) or normal adjacent lung (N) on the same slide was microdissected and then used for DNA extraction and PCR analysis with Dok2 genotyping primers that distinguish between the KO allele (upper band) and wild-type allele (lower band).

References

    1. Carpino N, et al. p62(dok): a constitutively tyrosine-phosphorylated, GAP-associated protein in chronic myelogenous leukemia progenitor cells. Cell. 1997;88:197–204. - PubMed
    1. Yamanashi Y, Baltimore D. Identification of the Abl- and rasGAP-associated 62 kDa protein as a docking protein, Dok. Cell. 1997;88:205–211. - PubMed
    1. Di Cristofano A, et al. Molecular cloning and characterization of p56dok-2 defines a new family of RasGAP-binding proteins. J Biol Chem. 1998;273:4827–4830. - PubMed
    1. Cong F, Yuan B, Goff SP. Characterization of a novel member of the DOK family that binds and modulates Abl signaling. Mol Cell Biol. 1999;19:8314–8325. - PMC - PubMed
    1. Grimm J, et al. Novel p62dok family members, dok-4 and dok-5, are substrates of the c-Ret receptor tyrosine kinase and mediate neuronal differentiation. J Cell Biol. 2001;154:345–354. - PMC - PubMed

Publication types

MeSH terms