. 2010 Mar;17(3):299-305.
doi: 10.1038/nsmb.1754. Epub 2010 Feb 7.

Systematic identification of fragile sites via genome-wide location analysis of gamma-H2AX

Affiliations

Systematic identification of fragile sites via genome-wide location analysis of gamma-H2AX

Rachel K Szilard et al. Nat Struct Mol Biol. 2010 Mar.

Abstract

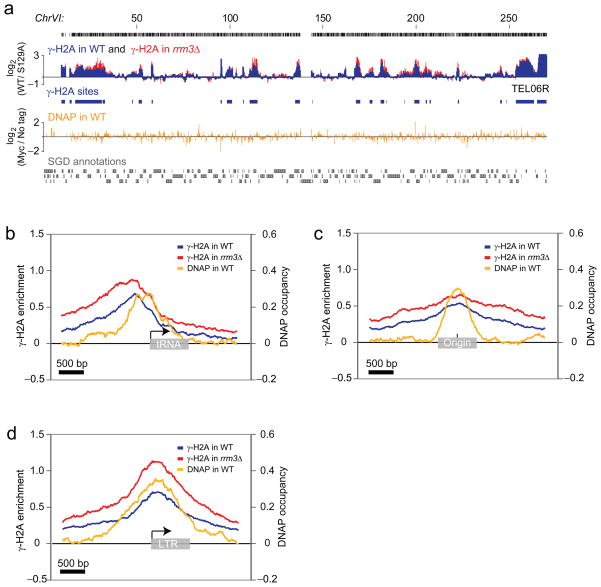
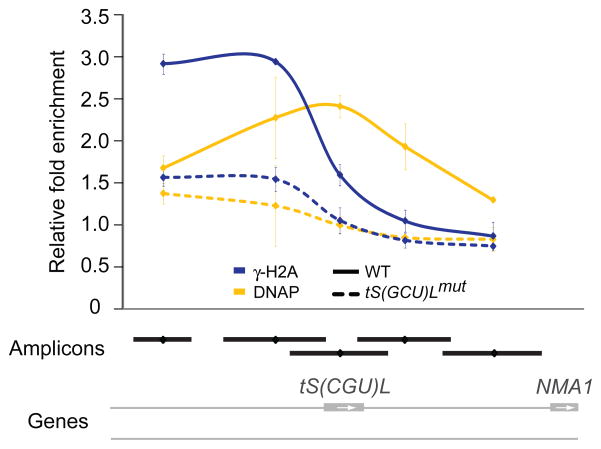
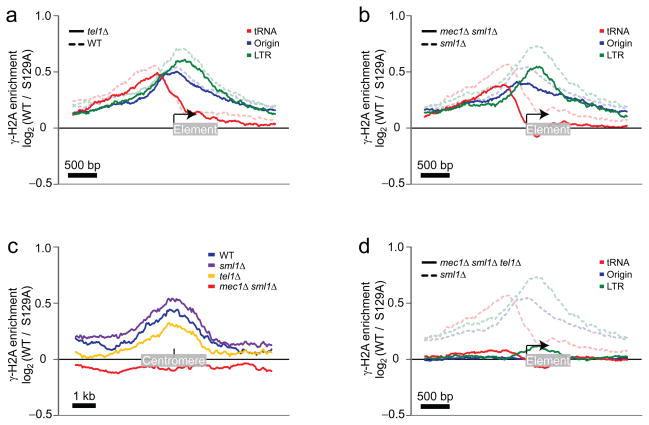
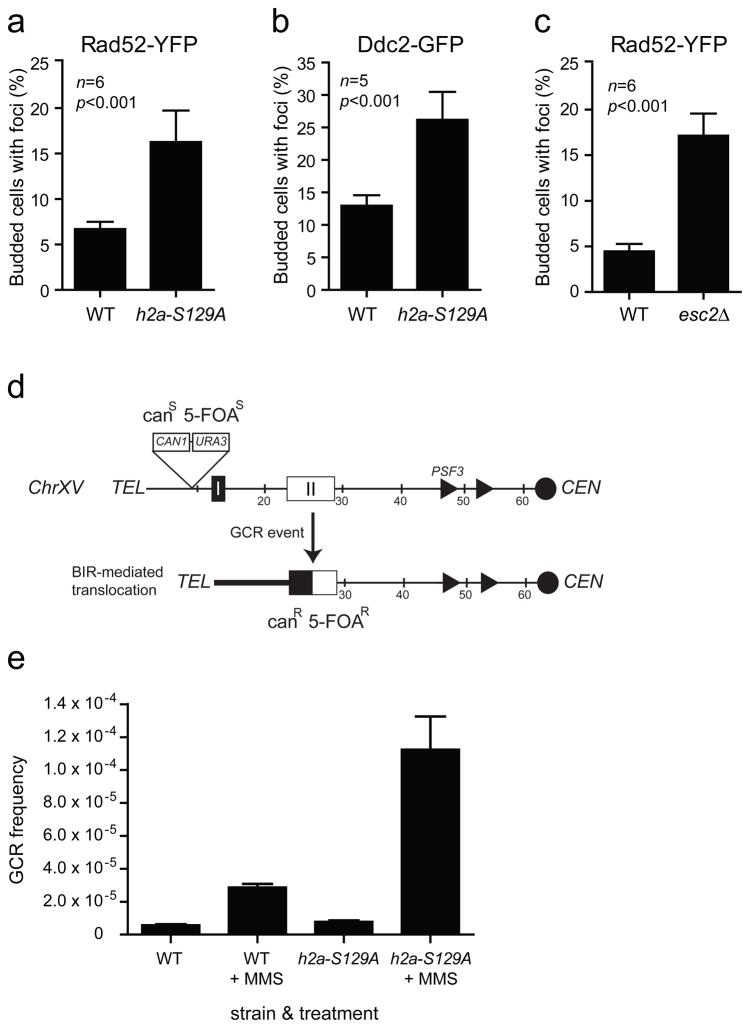
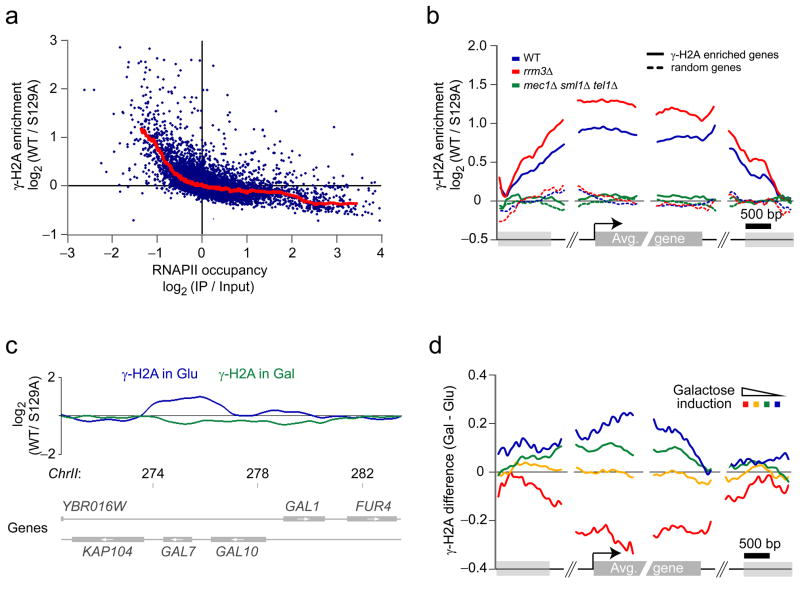
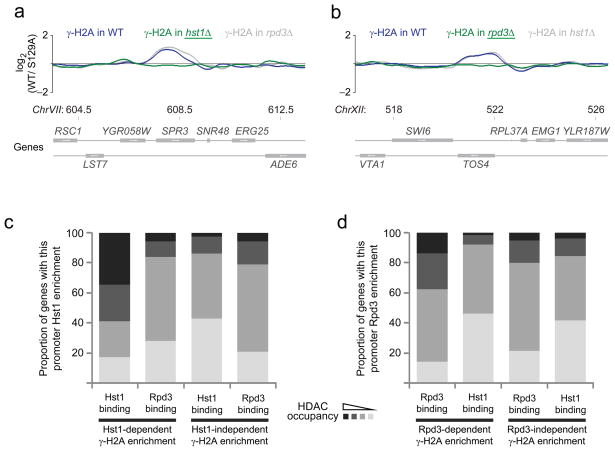
Phosphorylation of histone H2AX is an early response to DNA damage in eukaryotes. In Saccharomyces cerevisiae, DNA damage or replication-fork stalling results in phosphorylation of histone H2A yielding gamma-H2A (yeast gamma-H2AX) in a Mec1 (ATR)- and Tel1 (ATM)-dependent manner. Here, we describe the genome-wide location analysis of gamma-H2A as a strategy to identify loci prone to engaging the Mec1 and Tel1 pathways. Notably, gamma-H2A enrichment overlaps with loci prone to replication-fork stalling and is caused by the action of Mec1 and Tel1, indicating that these loci are prone to breakage. Moreover, about half the sites enriched for gamma-H2A map to repressed protein-coding genes, and histone deacetylases are necessary for formation of gamma-H2A at these loci. Finally, our work indicates that high-resolution mapping of gamma-H2AX is a fruitful route to map fragile sites in eukaryotic genomes.


Figures

Figure 1
Figure 1
Genome-wide location analysis of γ-H2A. (a) Genome browser capture of ChrVI. The log2γ-H2A/γ-H2A h2a-S129A enrichment ratio is shown for wild-type (WT; blue) and rrm3Δ (red) cells, along with the γ-H2A sites identified in the WT strain (blue boxes). The log2 DNAP-myc/untagged occupancy ratio is also shown (gold). The probes are shown as black bars and the Saccharomyces Genome Database (SGD) annotations are shown in grey. Chromosomal positions are indicated in kilobases. (b-d) Natural replication fork barriers promote γ-H2A formation. The average γ-H2A enrichment ratio for WT (blue) and rrm3Δ (red) cells, as well as the DNAP occupancy ratio (gold), are mapped on the complete non-mitochondrial sets of tRNA genes (b), DNA replication origins (c) and LTRs (d).
Figure 2
Figure 2
Mutation of the TFIIIB-binding site of a tRNA gene abolishes DNA polymerase and γ-H2A enrichment. Data is represented as the average relative fold enrichment and standard deviation of two experiments obtained by qPCR for DNAP (gold) and γ-H2A (blue) from WT (solid curves) and tS(GCU)Lmut (dashed curves) strains. The amplicons are represented as black lines and the SGD annotations are shown in grey.
Figure 3
Figure 3
Mapping of the γ-H2A enrichment in cells harboring different combinations of TEL1, MEC1 and SML1 deletions on natural replication fork barriers. (a) Enrichment of γ-H2A from WT cells (blue curves from Figure 1b-d) are grouped on the same graph (tRNA genes in red, DNA replication origins in blue, and LTRs in green) and presented in dashed transparent curves while the γ-H2A enrichment detected in the tel1Δ cells is shown in solid curves. (b) As in a except that solid curves were obtained from mec1Δ sml1Δ cells while dashed curves represent sml1Δ control cells. (c) The γ-H2A enrichment was mapped in the middle of the 16 centromeres in WT (blue), sml1Δ (purple), tel1Δ (gold) and mec1Δ sml1Δ (red) cells. (d) As in b except that solid curves were obtained from the mec1Δ sml1Δ tel1Δ cells.
Figure 4
Figure 4
Mutation of the H2A Ser129 residue increases the frequency of gross chromosomal rearrangements. (a-b) The h2a-S129A mutation results in an accumulation of Rad52-YFP (a) and Ddc2-GFP (b) foci. (c) Rad52-YFP foci accumulate in esc2Δ cells. Data is represented as the average and standard deviation of 6 (a,b) or 5 (c) experiments. Statistical significance (p value) was obtained with an unpaired t test. (d) The ChrXV-L GCR reporter chromosome. The assay monitors the loss of CAN1 and URA3 genes inserted ~10 kb from the telomere of ChrXV-L. This chromosome arm contains two regions of homology (HRI centered on the PAU20 gene, and HRII centered on the HXT11 gene) located 12 kb and 25 kb from the telomere that share a high degree of sequence identity with 21 regions in the genome. Consequently, DNA lesions formed at loci telomeric to HRI or HRII are predominantly repaired by BIR, thereby converting a canavanine- and 5-fluoroorotic acid (5-FOA)-sensitive strain (canS FOAS) into a canavanine and 5-FOA-resistant strain (canR 5-FOAR). (e) The h2a-S129A mutation results in an increased frequency of drug-induced GCR events. Cells carrying the ChrXV-L GCR reporter chromosome were grown in the presence or absence of MMS and assayed for survival on media containing 5-FOA and canavanine. Data is represented as the average frequency of GCR events and standard error of the mean of 6 experiments.
Figure 5
Figure 5
Many inactive genes display γ-H2A enrichment. (a) Anti-correlation between γ-H2A and RNAPII occupancy for the least transcribed genes. The average γ-H2A enrichment is plotted against RNAPII occupancy as determined by ChIP-chip in the same conditions. (b) γ-H2A accumulation at inactive genes is enhanced in rrm3Δ cells and is abolished in mec1Δ sml1Δ tel1Δ cells. The average γ-H2A enrichment ratios for WT (blue), rrm3Δ (red) and mec1Δ sml1Δ tel1Δ (green) cells are mapped relative to the 5′ and 3′ boundaries of protein-coding genes enriched for γ-H2A (solid curves) and on a random group containing the same number of genes (dashed curves). (c) Gene activation abolishes the accumulation of γ-H2A at repressed protein-coding genes. The smoothed γ-H2A enrichment ratios for cells grown in presence of glucose (blue) and galactose (green) are shown at the GAL7-10-1 locus. Chromosomal positions are indicated in kilobases. (d) The variation of γ-H2A level is correlated with galactose induction. The difference of γ-H2A enrichment ratios between cells grown in the presence of galactose (Gal) or glucose (Glu) is mapped (as in b) on groups of genes based on their fold change of expression in the presence of galactose.
Figure 6
Figure 6
γ-H2A accumulation at many inactive genes depends on HDAC activities. (a-b) The smoothed γ-H2A enrichment ratio is shown at selected Hst1 (a) and Rpd3 (b) target genes in WT cells (blue curves) and hst1 or rpd3 mutant (green curves) cells (the complementary mutant curves are in grey). Chromosomal positions are indicated in kilobases. (c-d) The deletion of Hst1 or Rpd3 preferentially affects γ-H2A enrichment at genes known to be physically associated with these HDACs according to previously published ChIP-chip data.

References

    1. Labib K, Hodgson B. Replication fork barriers: pausing for a break or stalling for time? EMBO Rep. 2007;8:346–53. - PMC - PubMed
    1. Durkin SG, Glover TW. Chromosome fragile sites. Annu Rev Genet. 2007;41:169–92. - PubMed
    1. Ivessa AS, et al. The Saccharomyces cerevisiae helicase Rrm3p facilitates replication past nonhistone protein-DNA complexes. Mol Cell. 2003;12:1525–36. - PubMed
    1. Ivessa AS, Zhou JQ, Schulz VP, Monson EK, Zakian VA. Saccharomyces Rrm3p, a 5′ to 3′ DNA helicase that promotes replication fork progression through telomeric and subtelomeric DNA. Genes Dev. 2002;16:1383–96. - PMC - PubMed
    1. Deshpande AM, Newlon CS. DNA replication fork pause sites dependent on transcription. Science. 1996;272:1030–3. - PubMed

Publication types

MeSH terms

Substances

Associated data