. 2010 Mar;11(3):225-31.
doi: 10.1038/ni.1844. Epub 2010 Feb 7.

Chromogranin A is an autoantigen in type 1 diabetes

Affiliations

Chromogranin A is an autoantigen in type 1 diabetes

Brian D Stadinski et al. Nat Immunol. 2010 Mar.

Abstract

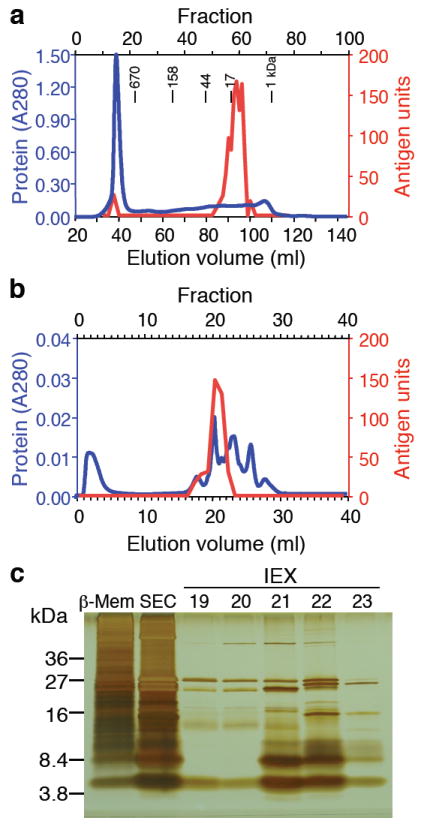
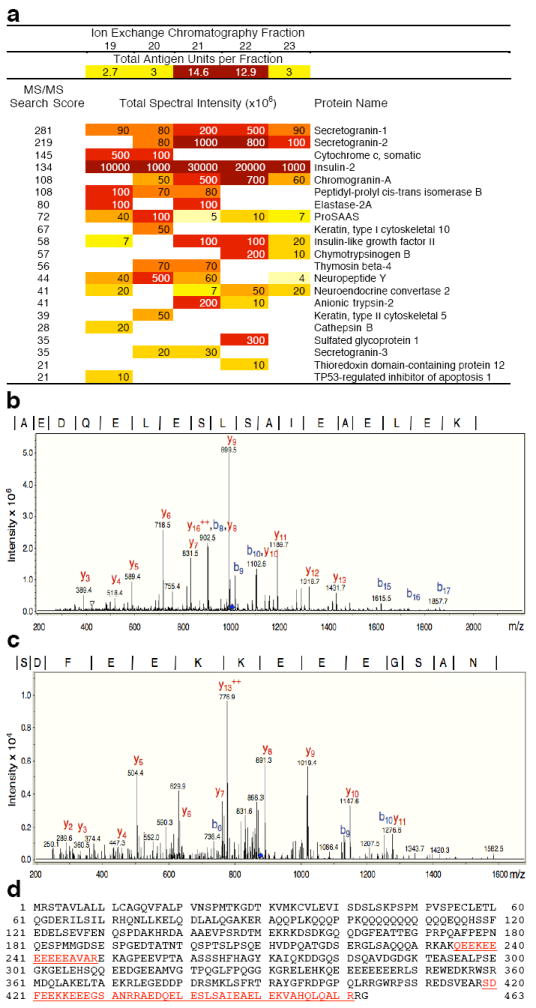
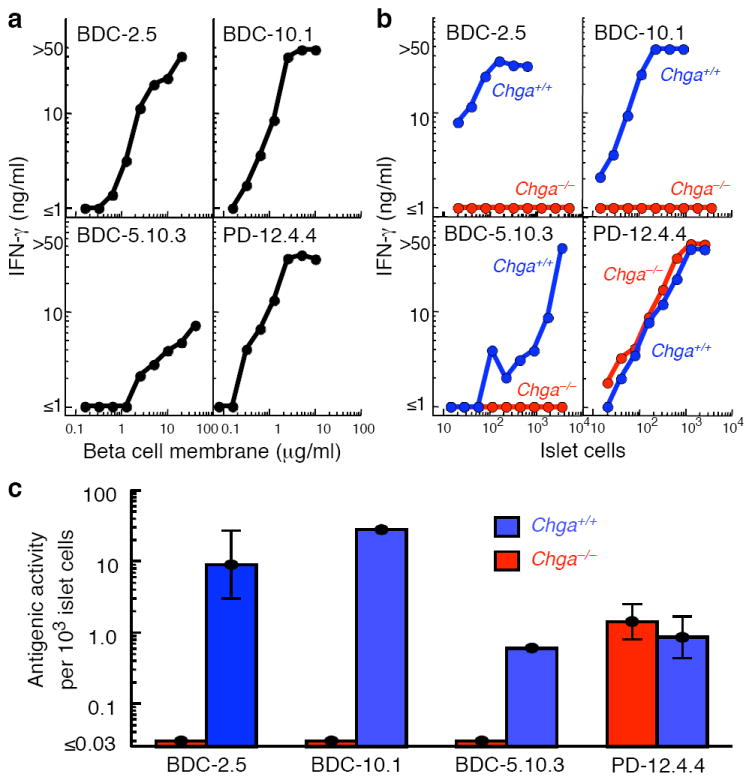
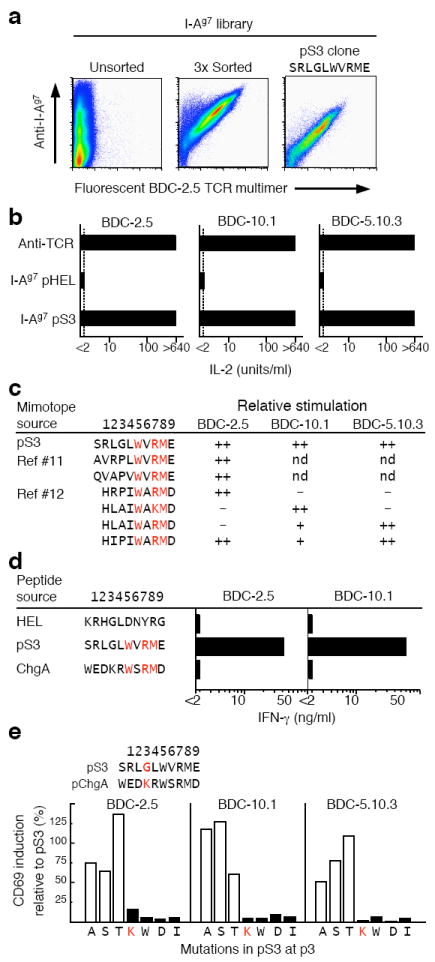
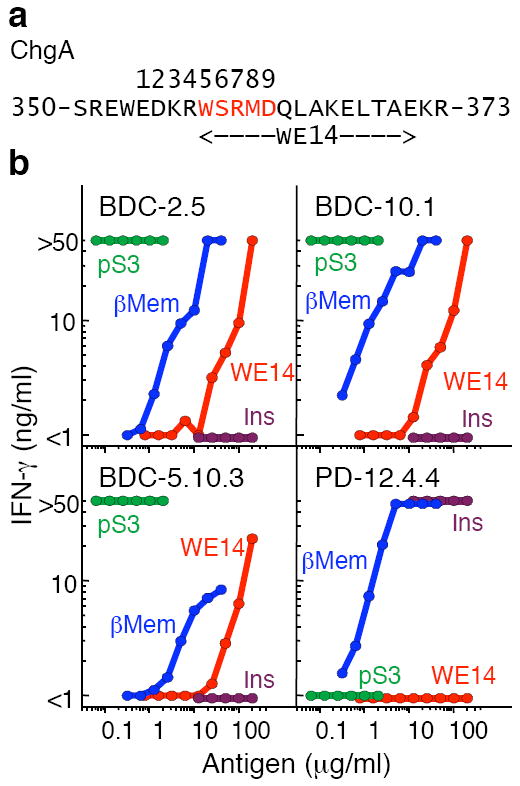
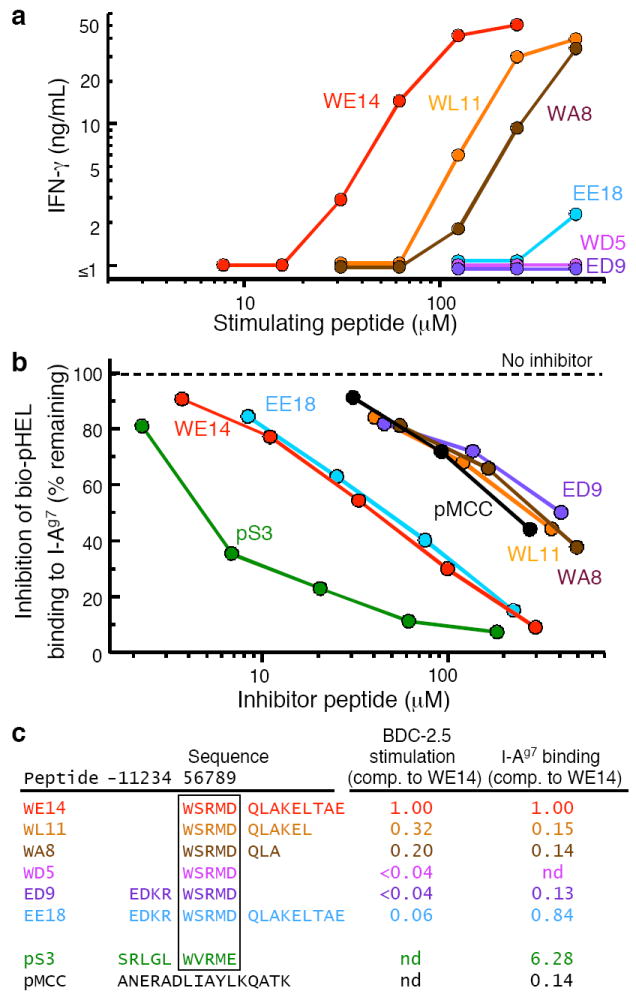
Autoreactive CD4(+) T cells are involved in the pathogenesis of many autoimmune diseases, but the antigens that stimulate their responses have been difficult to identify and in most cases are not well defined. In the nonobese diabetic (NOD) mouse model of type 1 diabetes, we have identified the peptide WE14 from chromogranin A (ChgA) as the antigen for highly diabetogenic CD4(+) T cell clones. Peptide truncation and extension analysis shows that WE14 bound to the NOD mouse major histocompatibility complex class II molecule I-A(g7) in an atypical manner, occupying only the carboxy-terminal half of the I-A(g7) peptide-binding groove. This finding extends the list of T cell antigens in type 1 diabetes and supports the idea that autoreactive T cells respond to unusually presented self peptides.


Figures

Figure 1
Figure 1
Purification of the antigen for the T cell clone BDC-2.5. (a) Size exclusion chromatography (SEC) of 13.8 mg β-cell membrane lysate and (b), anion exchange (IEX) chromatography of pooled antigenic SE fractions 60-62. The protein content for each chromatographic fractionation was monitored by its absorption at 280 nm (blue lines). The fractions obtained were tested for the presence of antigen with the T cell clone BDC-2.5 (red lines). One antigen unit (A.U.) induces the production of 10 ng/ml IFN-γ under standard antigen assay conditions. (c) Tricine-Tris gel electrophoresis of 4 A.U. β-cell membrane lysate (β-Mem) and 4 A.U. pooled antigenic SEC fractions 60-62. Remaining lanes contain 4 A.U. of the peak antigenic IEX fraction 21 and identical sample sizes (<4 A.U.) of the adjacent IEX fractions 19, 20, 22 and 23. Data from chromatograms and gel electrophoresis are representative of at least 3 independent experiments. The purification table (Table 1) correlates to the data obtained from the chromatograms and SDS-PAGE in this figure.
Figure 2
Figure 2
Mass spectrometric analysis of IEX fractions. Proteins in highly purified antigenic IEX fraction 21 and adjacent fractions (Fig. 1b) that displayed lower antigenic activity (fractions 19, 20, 22 and 23) were digested with trypsin and after separation by HPLC, were analyzed using an ion trap mass spectrometer. Resulting spectra were searched against a protein sequence database. (a) Proteins identified in each fraction following database searching. The summarized numeric spectral intensity of the individual peptides identified is an indicator for the relative abundance of a specific protein in a fraction. Darker colors indicate higher intensity. MS/MS Search scores (far left column) greater than 20 are considered significant. (b,c) Ion trap mass spectra matching to two ChgA peptides: AEDQELESLSAIEAELEK (b) and SDFEEKKEEEGSAN (c) are shown (data are representative of 5 independent runs). Peptide amino acid sequence is shown at the top; vertical lines in the sequence correspond to b-ion series (progressing from the N-terminus to the C-terminus) and the complementary y-ion series (progressing from the C-terminus to the N-terminus). (d) Complete ChgA amino acid sequence is shown and the four peptides that were detected and matched to ChgA are underlined.
Figure 3
Figure 3
Absence of the T cell antigen in islets from Chga−/− mice. Examples of the IFN-γ response (ng/ml) of the BDC-2.5, BDC-10.1, BDC-5.10.3 and (insulin-reactive) PD-12.4.4 T cell clones to (a) various concentrations of beta cell tumor membrane proteins or (b) various numbers of islet cells obtained from Chga−/− mice (red) or control Chga+/+ mice (blue). (c) Summary of all experiments performed as in (b). The average concentration of antigen in the islet cells from Chga−/− (red bars) or Chga+/+ (blue bars) mice is expressed as antigen units per 103 islet cells, with one unit of antigen defined as the amount required to induce the production of 10 ng/ml of IFN-γ. The data for BDC-2.5 and PD-12.4.4 are from 4 experiments (1-4 replicates per experiment), for BDC-10.1 from two experiments (1-2 replicates per experiment), and for BDC-5.10.3 from one experiment with a single sample. Error bars (SEM) are shown for the BDC-2.5 and PD-12.4.4 data.
Figure 4
Figure 4
Mimotope peptide antigens for the BDC T cells suggest the region of ChgA encoding the epitope for the BDC T cells. (a) A fluorescent, oligomerized, soluble BDC-2.5 TCR was used to enrich from a baculovirus library a virus encoding an I-Ag7-mimotope (pS3) that forms a strong ligand for the BDC-2.5 TCR (see Methods for details). The data are from a single flow cytometry experiment performed after the sorting and cloning of the library were completed. SF9 cells were infected with either the unsorted library (left panel), 3 times sorted library (middle panel) or pS3 clonal virus (right panel) and analyzed for I-Ag7 expression vs. binding of the TCR reagent. (b) BDC T cell hybridomas were stimulated in culture either with immobilized H597 anti-TCR Cβ Mab or with CD80+ICAM-expressing SF9 cells infected with virus encoding I-Ag7 with a HEL peptide or I-Ag7 with pS3. IL-2 production was assayed after 24 h. Results are representative of three experiments, each assayed in duplicate. (c) The sequence and activity of the pS3 mimotope were compared to those previously identified using other library techniques,. The reported potency of the mimotopes in stimulating the 3 BDC T cell clones is represented qualitatively: ++, very strong stimulation; +, modest stimulation; −, little or no stimulation, and is based upon the results shown in panel b for pS3 and as previously reported, for the other mimotopes. Motif positions p5, p7, p8 are highlighted in red. (d) Baculovirus encoding membrane-anchored I-Ag7 covalently bound to each of three peptides (pHEL, pS3, and the ChgA-derived peptide, WEDKRWSRMD) were prepared. CD80+ICAM-expressing SF9 cells were infected with the viruses and tested for stimulation of IFN-γ production by the BDC-2.5 and BDC-10.1 T cell clones. Results are from a single experiment performed in duplicate. (e) Mutation of pS3 p3 glycine to other amino acids. The effect of the mutations on early activation of the three BDC hybridomas was assessed by CD69 surface expression by flow cytometry. The results are shown as the percent of cells expressing CD69 relative to those activated with the unmutated pS3 peptide. The sequences of the pS3 and ChgA peptide are shown, highlighting the amino acids at the p3 position in red. The results are from a single experiment.
Figure 5
Figure 5
The ChgA derived peptide, WE14, activates all three BDC T cells. (a) A portion of the chromogranin A (ChgA) amino acid sequence with the WE14 peptide indicated. Putative positions in the I-Ag7 peptide-binding groove (positions 1–9) are shown and the motif common to the antigen peptide mimotopes is highlighted in red. (b) IFN-γ response (ng/ml) of the BDC-2.5, BDC-10.1, BDC-5.10.3 and PD-12.4.4 T cell clones stimulated by various peptide concentrations of pS3 (green), WE14 (red), INS2 B9-23 (SHLVEALYLVCGERG) (purple) and beta cell tumor membrane preparation (β-Mem) (blue). Peptide antigen was titrated in each assay and the data is representative of at least two separate experiments with single measurements at each peptide concentration.
Figure 6
Figure 6
Precise processing of the WE14 peptide required for optimal presentation by I-Ag7. (a) IFN-γ response of the BCD-2.5 T cell clone to varying concentrations (5–500 μM) of ChgA-derived peptides. Data are representative of two separate experiments containing single measurements at each peptide concentration. (b) ChgA derivative peptides were tested for their ability to compete with a biotinylated HEL peptide (bio-pHel) for binding to soluble I-Ag7. The pS3 mimotope was used as a positive control peptide and an I-Ek binding peptide from moth cytochrome c (pMCC) was used as negative control peptide. The data (the average of two experiments with very similar results) are presented as the amount of biotinylated HEL peptide bound to I-Ag7 (expressed as the percent of that bound in the absence of an inhibitor peptide) vs. the concentration of inhibitor peptide. (c) A multiple regression program (MKASSAY, available on request) was used to analyze the stimulation and inhibition curves in (a) and (b), treating them as a series of parallel polynomial curves. The results are presented as the stimulatory or inhibitory activity of the peptides relative to WE14.

Similar articles

Cited by

References

    1. Haskins K, Portas M, Bergman B, Lafferty K, Bradley B. Pancreatic islet-specific T-cell clones from nonobese diabetic mice. Proc Natl Acad Sci USA. 1989;86:8000–8004. - PMC - PubMed
    1. Haskins K. Pathogenic T-cell clones in autoimmune diabetes: more lessons from the NOD mouse. Adv Immunol. 2005;87:123–162. - PubMed
    1. Bergman B, Haskins K. Islet-specific T-cell clones from the NOD mouse respond to β-granule antigen. Diabetes. 1994;43:197–203. - PubMed
    1. Bergman B, McManaman JL, Haskins K. Biochemical characterization of a beta cell membrane fraction antigenic for autoreactive T cell clones. J Autoimmun. 2000;14:343–351. - PubMed
    1. Acha-Orbea H, McDevitt HO. The first external domain of the nonobese diabetic mouse class II I-A β chain is unique. Proc Natl Acad Sci USA. 1987;84:2435–2439. - PMC - PubMed

Publication types