. 2010 Mar;11(3):265-72.
doi: 10.1038/ni.1843. Epub 2010 Feb 7.

HVCN1 modulates BCR signal strength via regulation of BCR-dependent generation of reactive oxygen species

Affiliations

HVCN1 modulates BCR signal strength via regulation of BCR-dependent generation of reactive oxygen species

Melania Capasso et al. Nat Immunol. 2010 Mar.

Abstract

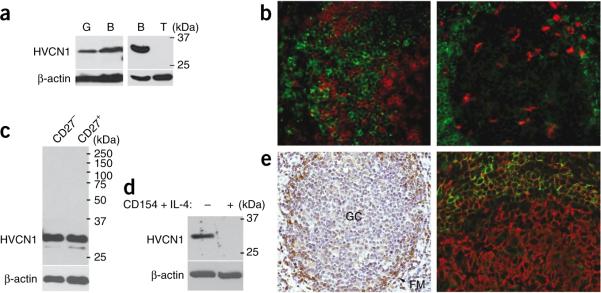
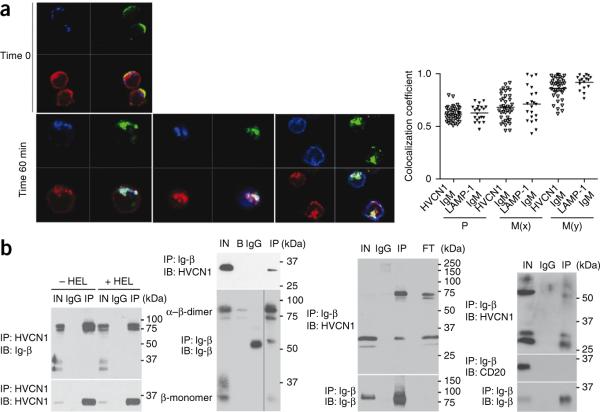
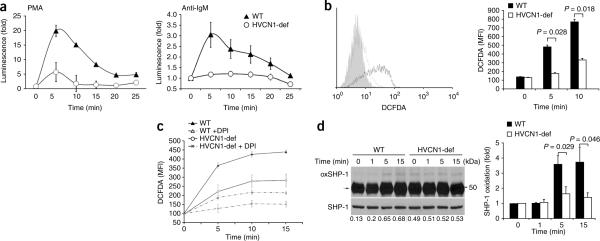
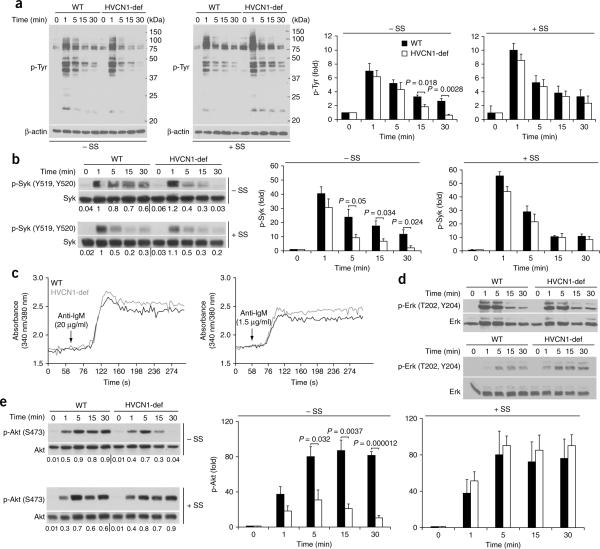
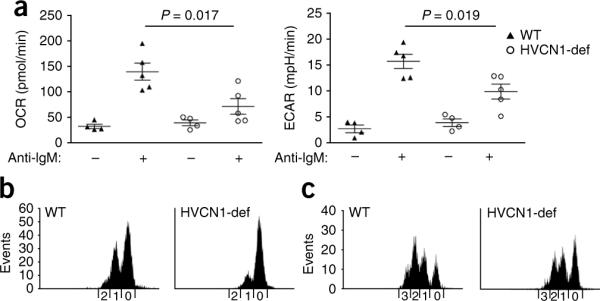
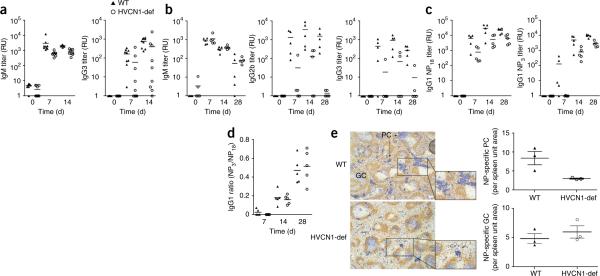
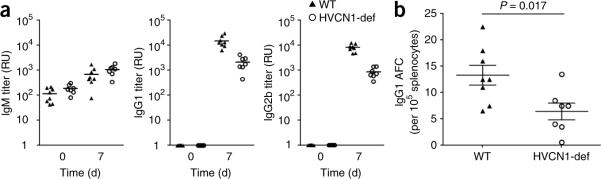
Voltage-gated proton currents regulate generation of reactive oxygen species (ROS) in phagocytic cells. In B cells, stimulation of the B cell antigen receptor (BCR) results in the production of ROS that participate in B cell activation, but the involvement of proton channels is unknown. We report here that the voltage-gated proton channel HVCN1 associated with the BCR complex and was internalized together with the BCR after activation. BCR-induced generation of ROS was lower in HVCN1-deficient B cells, which resulted in attenuated BCR signaling via impaired BCR-dependent oxidation of the tyrosine phosphatase SHP-1. This resulted in less activation of the kinases Syk and Akt, impaired mitochondrial respiration and glycolysis and diminished antibody responses in vivo. Our findings identify unanticipated functions for proton channels in B cells and demonstrate the importance of ROS in BCR signaling and downstream metabolism.


Figures

Figure 1
Figure 1
HVCN1 protein expression in B cells. (a) Immunoblot analysis of HVCN1 expression in human peripheral granulocytes (G), B cells (B) and T cells (T) with a rabbit polyclonal antibody that recognizes a sequence in the amino-terminal domain of HVCN1 (amino acids 26–46; antibody confirmation, Supplementary Fig. 1c,d). β-actin serves as loading control throughout. Right margin, molecular sizes in kilodaltons (kDa). (b) Confocal images of paraffin-embedded tonsil sections stained with anti-HVCN1 (green) and anti-CD3 (red; T cells; left) or with anti-HVCN1 (green) and anti-CD68 (red; GC macrophages; right). Original magnification, ×20. (c,d) HVCN1 expression in human peripheral blood naive (CD27) B cells and memory (CD27+) B cells (c) and in B cells activated on L cells expressing CD154 in the presence of IL-4 (10 ng/ml) for 24 h (d). (e) Immunohistochemistry of paraffin-embedded tonsil sections stained with anti-HVCN1 (left) or with anti-HVCN1 (green) and anti-CD20 (red; all B cells; right). FM, follicular mantle. Original magnification, ×20. Data are representative of three (a,b,e), two (c) or four (d) experiments.
Figure 2
Figure 2
Association of HVCN1 with the BCR. (a) Confocal images (left) of human peripheral blood B cells stained for LAMP-1 (blue), IgM (green) and HVCN1 (red) before activation with fluorescein isothiocyanate–conjugated F(ab′)2 anti-IgM (Time 0; top) and colocalization of IgM and HVCN1 with markers for MIICs at 60 min after activation (bottom). Original magnification, ×100. Right, quantification of colocalization coefficients (n = 39 cells), presented in a range from 0 (no colocalization) to 1 (total colocalization). P, Pearson's coefficient (total value of colocalization); M(x) and M(y), extent of overlap of signal x with signal y and vice versa, where x is either HVCN1 or LAMP1 and y is IgM. Each symbol represents an individual cell; small horizontal lines indicate the mean. (b) Coimmunoprecipitation of overexpressed HVCN1 and endogenous immunoglobulin-associated-β (Ig-β) in the A20 D1.3 cell line in nonreducing conditions with (+HEL) or without (−HEL) 30 min of stimulation with 5 μM HEL (far left) or in LK35.2 HyHEL10 cells in nonreducing conditions (left middle), and coimmunoprecipitation of endogenous HVCN1 and immunoglobulin-associated-β in human peripheral blood CD19+ cells in nonreducing conditions (right middle) or in the mantle cell line GRANTA 519 in reducing conditions (far right). IN, input cell lysate; IgG, negative control beads conjugated to rat IgG; IP, immunoprecipitation; IB, immunoblot; B, negative control beads; FT, flow-through (protein lysate after immunoprecipitation with immunoglobulin-associated-β). CD20, membrane protein (negative control). Data are representative of two (a) or five (b) experiments.
Figure 3
Figure 3
BCR stimulation results in less BCR-dependent production of ROS and SHP-1 oxidation in the absence of HVCN1. (a) Chemiluminescent measurement of ROS after stimulation of splenic B cells with 1 μM phorbol 12-myristate 13-acetate (PMA (left); n = 5 mice) or F(ab′)2 anti-IgM (20 μg/ml (right); n = 4 mice). (b) Flow cytometry (left) of HVCN1-deficient B cells (gray line) and wild-type B cells (black line) 5 min after activation with F(ab′)2 anti-IgM conjugated to DCFDA (20 μg/ml). Gray filled histogram, antibody-labeled cells left on ice to prevent activation. Right, quantification of results at left. MFI, mean fluorescent intensity. P values, Student's t-test. (c) Measurement of ROS (assessed as DCFDA fluorescence) in wild-type and HVCN1-deficient B cells stimulated with F(ab′)2 anti-IgM conjugated to DCFDA (20 μg/ml), with (+ DPI; dashed lines) or without (solid lines) pretreatment of cells with 10 μM DPI before activation. (d) Immunoprecipitation of oxidized SHP-1 (left) from splenic B cells activated with F(ab′)2 anti-IgM (20 μg/ml). Arrow indicates biotinylated antibody heavy chains. Numbers below lanes, densitometry of streptavidin–horseradish peroxidase bands versus SHP-1 bands. Right, SHP-1 oxidation, presented relative to oxidation before stimulation. P values, Student's t-test. Data are representative of four experiments (a; mean ± s.e.m.), four separate experiments (b; average and s.d.), three experiments (c; mean ± s.e.m. of five mice), five separate experiments (d; mean and s.e.m.).
Figure 4
Figure 4
Absence of HVCN1 results in less tyrosine phosphorylation and impaired activation of Syk and Akt. (a) Immunoblot analysis (left) of phosphorylated tyrosine (p-Tyr) in splenic B cells activated with F(ab′)2 anti-IgM (20 μg/ml) in the absence (−SS) or presence (+SS) of 5 μM sodium stibogluconate (an inhibitor of SHP-1). Right, densitometry analysis of bands at left. Data represent the average of four separate experiments (mean and s.e.m.). (b) Immunoblot analysis of Syk phosphorylated at Tyr519 and Tyr520 (p-Syk (Y519,Y520)) in splenic B cells activated with F(ab′)2 anti-IgM (20 μg/ml) in the presence or absence of 5 μM sodium stibogluconate; below, reprobing of blots to detect total Syk. Numbers below lanes indicate densitometry of phosphorylated Syk bands versus total Syk bands. Right, Syk phosphorylation, presented relative to phosphorylation before stimulation. Data represent the average of four independent experiments (mean and s.e.m.). (c) Ca2+ mobilization in response to BCR stimulation with F(ab′)2 anti-IgM (20 μg/ml (top) or 1.5 μg/ml (bottom)), presented as the increase in intracellular Ca2+ (vertical axis) as a function of time (horizontal axis). Data are representative of seven independent experiments (reported in Supplementary Fig. 7b). (d) Immunoblot analysis of Erk phosphorylated at Thr202 and Tyr204 (p-Erk (T202,Y204)) in splenic B cells stimulated with F(ab′)2 anti-IgM (20 μg/ml (top) or 1.5 μg/ml (bottom)). Data represent three independent experiments. (e) Immunoblot analysis of Akt phosphorylated at Ser473 (p-Akt (S473)) after BCR stimulation in the presence or absence of sodium stibogluconate. Numbers below lanes indicate densitometry of phosphorylated Akt bands versus total Akt bands. Right, Akt phosphorylation, presented relative to phosphorylation before stimulation. Data represent the average of four separate experiments (mean and s.e.m.). P values, Student's t-test.
Figure 5
Figure 5
HVCN1 deficiency results in impaired cellular metabolism and proliferation in vitro. (a) Metabolic rates in wild-type and HVCN1-deficient B cells before (−) and after (+) stimulation for 24 h with F(ab′)2 anti-IgM (20 μg/ml), presented as the oxygen consumption rate (OCR) and extracellular acidification rate (ECAR; assesses lactic acid production or glycolysis). Each symbol represents an individual mouse; longer horizontal lines indicate the mean and small horizontal lines indicate the standard error. P values, Student's t-test. Data are representative of three experiments with four mice (time 0) or five mice (24 h). (b,c) CFSE staining of splenic B cells stimulated for 48 h (b) or 72 h (c) with F(ab′)2 anti-IgM (1 μg/ml) and IL-4 (20 ng/ml). Numbers along horizontal axes indicate the number of cell divisions. Data are representative of three separate experiments with similar results.
Figure 6
Figure 6
Impaired antibody responses in HVCN1-deficient mice. (a) Anti-NP titers in mice (n = 9) immunized with 100 μg NP-Ficoll, presented in relative units (RU) as serial dilution of serum relative to antibody end-point titers. P < 0.0001, IgM, and P = 0.024, IgG3 (Mann-Whitney), and P < 0.0001, IgM, and P = 0.0054, IgG3 (two-way analysis of variance). Data are representative of QQ experiments. (b) Anti-NP titers in mice (n = 5) immunized with 100 μg NP-KLH. P < 0.05, IgG2b and IgG3 (Mann-Whitney test), and P < 0.0001, IgG2b, and P = 0.0002, IgG3 (two-way analysis of variance). Data are representative of experiments repeated twice. (c) Anti-NP IgG1 titers in mice (n = 5) immunized with 100 μg NP-KLH. P < 0.05 (Mann-Whitney test), P = 0.0002 (two-way analysis of variance). Data are representative of experiments repeated twice. (d) Affinity of IgG1 antibodies, presented as the ratio of IgG1 titers detected with NP3-BSA to those detected with NP18-BSA. Data are representative of two experiments. Each symbol (ad) represents an individual mouse; small horizontal lines indicate the mean. (e) Immunohistochemistry (left) of serial spleen sections stained with anti-NP (blue) and anti-IgD (brown) 12 d after immunization with NP-KLH, showing NP-specific GC and extrafollicular foci of plasmacytoid cells (PC; plasmablasts and plasma cells). Original magnification, ×5. Right, quantification of plasmacytoid cells (top) and GCs (bottom). Each symbol represents an individual mouse; longer horizontal lines indicate the mean and small horizontal lines indicate the standard error. Data are representative of three experiments.
Figure 7
Figure 7
B cell–autonomous impaired antibody responses in HVCN1-deficient mice. (a) Antibody responses to immunization with 100 μg NP-KLH in chimeric mice. Each symbol represents an individual mouse; small horizontal lines indicate the mean. P = 0.0008, IgG1, and P < 0.0001, IgG2b (Student's t-test). Data are representative of two experiments with eight wild-type mice and seven HVCN1-deficient mice. (b) Enzyme-linked immunospot analysis of splenic NP-specific IgG1 antibody–forming cells (AFC). Each symbol represents an individual mouse; longer horizontal lines indicate the mean and small horizontal lines indicate the standard error. Data are representative of two experiments with eight wild-type mice and seven HVCN1-deficient mice.

Comment in

References

    1. Batista FD, Neuberger MS. Affinity dependence of the B cell response to antigen: a threshold, a ceiling, and the importance of off-rate. Immunity. 1998;8:751–759. - PubMed
    1. Paus D, et al. Antigen recognition strength regulates the choice between extrafollicular plasma cell and germinal center B cell differentiation. J. Exp. Med. 2006;203:1081–1091. - PMC - PubMed
    1. Reth M, Brummer T. Feedback regulation of lymphocyte signalling. Nat. Rev. Immunol. 2004;4:269–277. - PubMed
    1. Okkenhaug K, Vanhaesebroeck B. PI3K in lymphocyte development, differentiation and activation. Nat. Rev. Immunol. 2003;3:317–330. - PubMed
    1. Zhang J, Somani AK, Siminovitch KA. Roles of the SHP-1 tyrosine phosphatase in the negative regulation of cell signalling. Semin. Immunol. 2000;12:361–378. - PubMed

Publication types