

Classifying coding DNA with nucleotide statistics
- PMID: 20140062
- PMCID: PMC2808172
- DOI: 10.4137/bbi.s3030
Classifying coding DNA with nucleotide statistics
Abstract
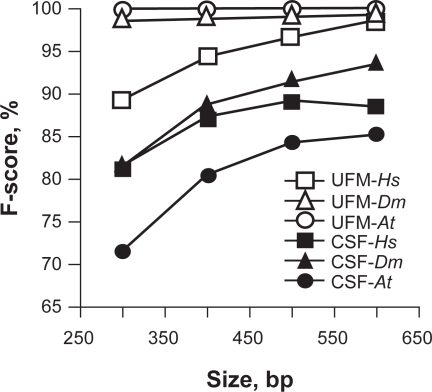
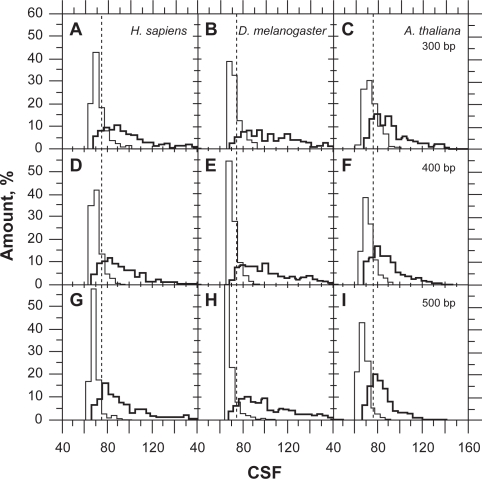
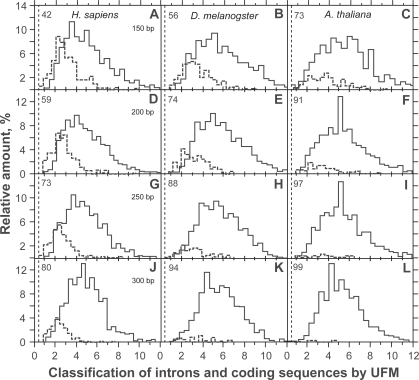
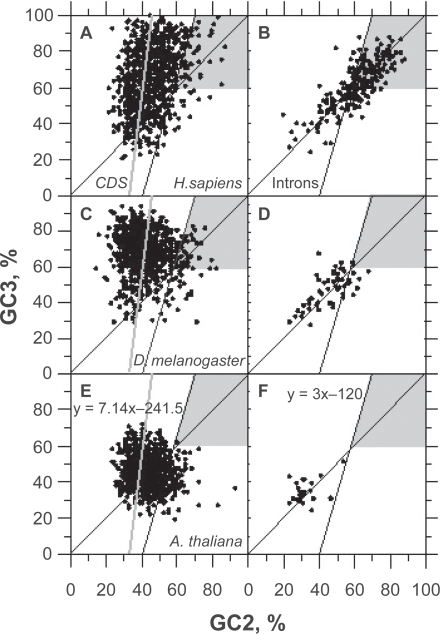
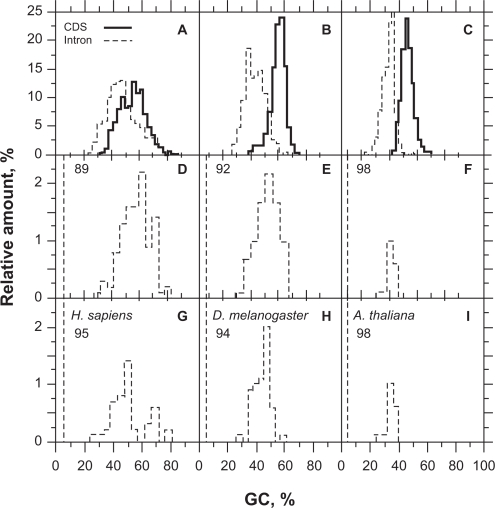
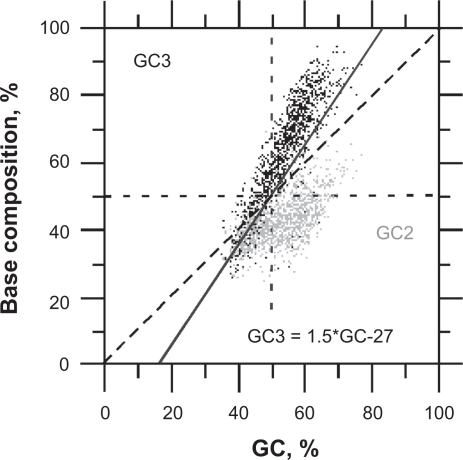
In this report, we compared the success rate of classification of coding sequences (CDS) vs. introns by Codon Structure Factor (CSF) and by a method that we called Universal Feature Method (UFM). UFM is based on the scoring of purine bias (Rrr) and stop codon frequency. We show that the success rate of CDS/intron classification by UFM is higher than by CSF. UFM classifies ORFs as coding or non-coding through a score based on (i) the stop codon distribution, (ii) the product of purine probabilities in the three positions of nucleotide triplets, (iii) the product of Cytosine (C), Guanine (G), and Adenine (A) probabilities in the 1st, 2nd, and 3rd positions of triplets, respectively, (iv) the probabilities of G in 1st and 2nd position of triplets and (v) the distance of their GC3 vs. GC2 levels to the regression line of the universal correlation. More than 80% of CDSs (true positives) of Homo sapiens (>250 bp), Drosophila melanogaster (>250 bp) and Arabidopsis thaliana (>200 bp) are successfully classified with a false positive rate lower or equal to 5%. The method releases coding sequences in their coding strand and coding frame, which allows their automatic translation into protein sequences with 95% confidence. The method is a natural consequence of the compositional bias of nucleotides in coding sequences.
Keywords: ancestral codon; coding features; genomics; open reading frame; purines bias; universal correlation.
Figures
Similar articles
-
The Purine Bias of Coding Sequences is Determined by Physicochemical Constraints on Proteins.Bioinform Biol Insights. 2014 May 20;8:93-108. doi: 10.4137/BBI.S13161. eCollection 2014. Bioinform Biol Insights. 2014. PMID: 24899802 Free PMC article.
-
A Statistical Method without Training Step for the Classification of Coding Frame in Transcriptome Sequences.Bioinform Biol Insights. 2013;7:35-54. doi: 10.4137/BBI.S10053. Epub 2013 Jan 23. Bioinform Biol Insights. 2013. PMID: 23400232 Free PMC article.
-
Universal Features for the Classification of Coding and Non-coding DNA Sequences.Bioinform Biol Insights. 2009 Jun 3;3:37-49. doi: 10.4137/bbi.s2236. Bioinform Biol Insights. 2009. PMID: 20140069 Free PMC article.
-
Constraint on di-nucleotides by codon usage bias in bacterial genomes.Gene. 2014 Feb 15;536(1):18-28. doi: 10.1016/j.gene.2013.11.098. Epub 2013 Dec 11. Gene. 2014. PMID: 24333347
-
Phase-dependent nucleotide substitution in protein-coding sequences.Biochem Biophys Res Commun. 2007 Apr 13;355(3):599-602. doi: 10.1016/j.bbrc.2007.01.006. Epub 2007 Jan 10. Biochem Biophys Res Commun. 2007. PMID: 17300744 Review.
Cited by
-
The Purine Bias of Coding Sequences is Determined by Physicochemical Constraints on Proteins.Bioinform Biol Insights. 2014 May 20;8:93-108. doi: 10.4137/BBI.S13161. eCollection 2014. Bioinform Biol Insights. 2014. PMID: 24899802 Free PMC article.
-
Common and phylogenetically widespread coding for peptides by bacterial small RNAs.BMC Genomics. 2017 Jul 21;18(1):553. doi: 10.1186/s12864-017-3932-y. BMC Genomics. 2017. PMID: 28732463 Free PMC article.
-
A Metagenomic Analysis of Bacterial Microbiota in the Digestive Tract of Triatomines.Bioinform Biol Insights. 2017 Sep 27;11:1177932217733422. doi: 10.1177/1177932217733422. eCollection 2017. Bioinform Biol Insights. 2017. PMID: 28989277 Free PMC article.
-
An Interpretation of the Ancestral Codon from Miller's Amino Acids and Nucleotide Correlations in Modern Coding Sequences.Bioinform Biol Insights. 2015 Apr 15;9:37-47. doi: 10.4137/BBI.S24021. eCollection 2015. Bioinform Biol Insights. 2015. PMID: 25922573 Free PMC article.
-
A Statistical Method without Training Step for the Classification of Coding Frame in Transcriptome Sequences.Bioinform Biol Insights. 2013;7:35-54. doi: 10.4137/BBI.S10053. Epub 2013 Jan 23. Bioinform Biol Insights. 2013. PMID: 23400232 Free PMC article.
References
LinkOut - more resources
Full Text Sources
Molecular Biology Databases
