. 2009 Jun 3:3:37-49.
doi: 10.4137/bbi.s2236.

Universal Features for the Classification of Coding and Non-coding DNA Sequences

Affiliations

Universal Features for the Classification of Coding and Non-coding DNA Sequences

Nicolas Carels et al. Bioinform Biol Insights. .

Abstract

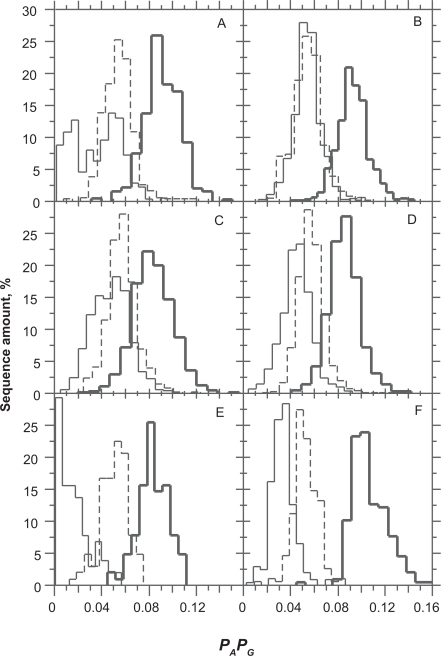
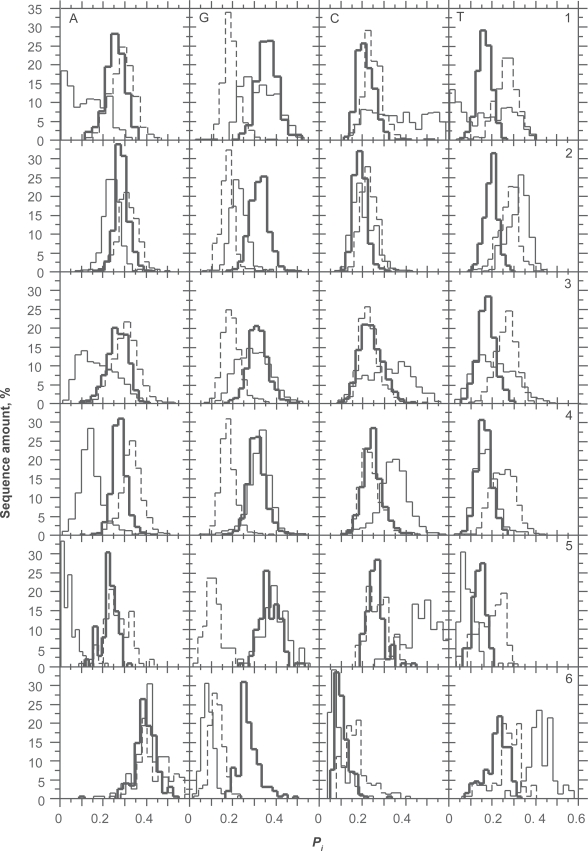
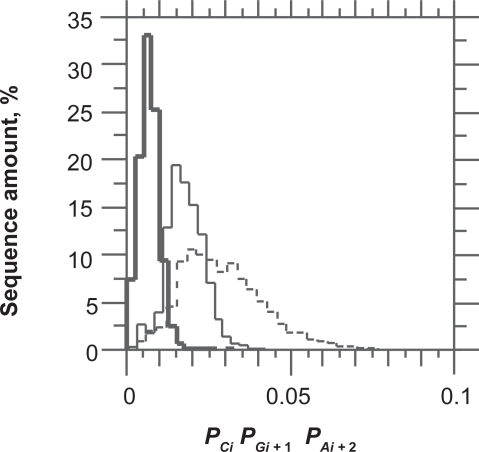
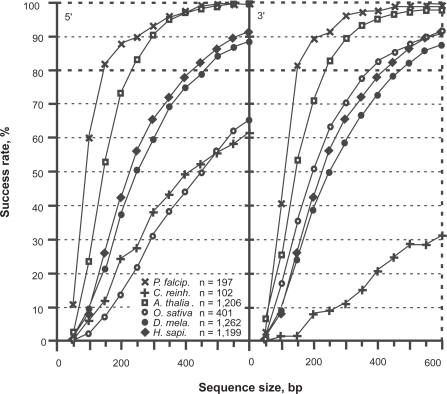
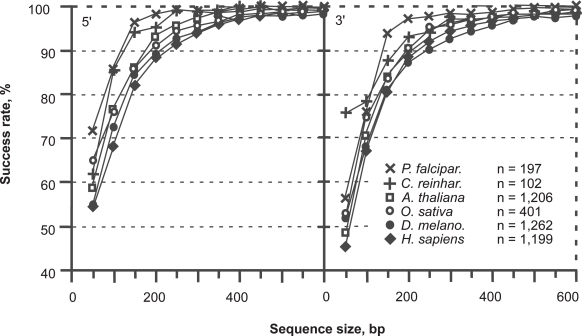
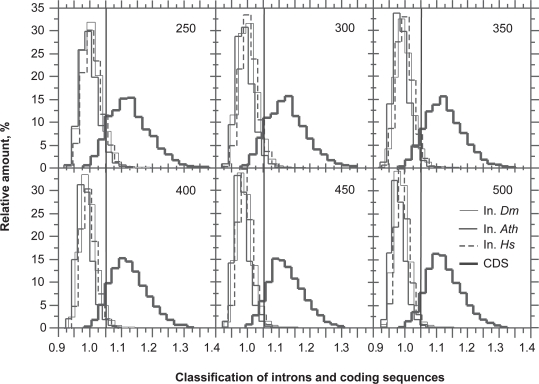
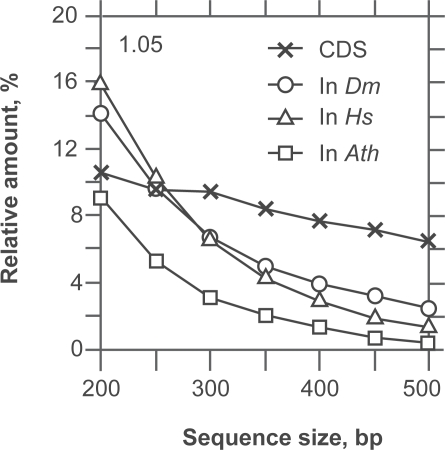
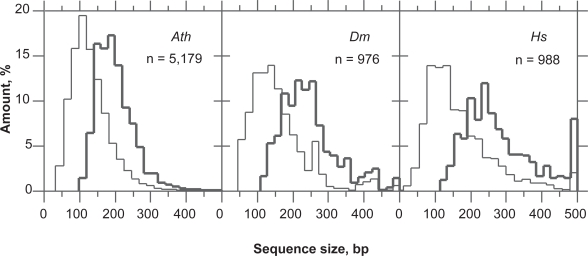
In this report, we revisited simple features that allow the classification of coding sequences (CDS) from non-coding DNA. The spectrum of codon usage of our sequence sample is large and suggests that these features are universal. The features that we investigated combine (i) the stop codon distribution, (ii) the product of purine probabilities in the three positions of nucleotide triplets, (iii) the product of Cytosine, Guanine, Adenine probabilities in 1st, 2nd, 3rd position of triplets, respectively, (iv) the product of G and C probabilities in 1st and 2nd position of triplets. These features are a natural consequence of the physico-chemical properties of proteins and their combination is successful in classifying CDS and non-coding DNA (introns) with a success rate >95% above 350 bp. The coding strand and coding frame are implicitly deduced when the sequences are classified as coding.

Keywords: ancestral codon; coding features; exon prediction; genomics; open reading frame; purine bias.


Figures

Figure 1.
Figure 1.
Distribution of the product of purines (A, G) probabilities (PAPB) in O. sativa (A), A. thaliana (B), H. sapiens (C), D. melanogaster (D), C. reinhardtii (E) and P. falciparum (F). The product of purine probabilities is higher, on average, in the 1st position of codons (bold) than in the 2nd (dashed) and in the 3rd (thin).
Figure 2.
Figure 2.
Distribution of nucleotide probabilities (A, G, C, T) in 1st (bold), 2nd (dashed) and 3rd (thin) positions of codons in O. sativa (1), A. thaliana (2), H. sapiens (3), D. melanogaster (4), C. reinhardtii (5) and P. falciparum (6).
Figure 3.
Figure 3.
Distribution of PC1PG2PA3 (bold), PG1PA2PC3 (dashed) and PA1PC2PG3 (thin) in the coding sequences of O. sativa, A. thaliana, H. sapiens, D. melanogaster, C. reinhardtii and P. falciparum grouped together.
Figure 4.
Figure 4.
Classification of the coding frame among the six frames of coding sequences between 50 and 600 bp. The success rate of S = f1 is shown for P. falciparum (X), C. reinhardtii (+), A. thaliana (□), O. sativa (O), D. melanogaster (•) and H. sapiens (♦), respectively.
Figure 5.
Figure 5.
Classification of the coding frame among the six frames of coding sequences between 50 and 600 bp. The success rate of the function S = f1 + f2 over six frames is shown for P. falciparum (X), C. reinhardtii (+), A. thaliana (□), O. sativa (O), D. melanogaster (•) and H. sapiens (♦), respectively.
Figure 6.
Figure 6.
Classification of coding sequences (CDS) and introns (In) between 250 and 500 bp and among the six frames. The intron distributions of A. thaliana (Ath, plain), D. melanogaster (Dm, thin) and H. sapiens (Hs, dashed) are centered on the classification value of 0.95. The CDS distribution of the six species grouped together (bold) are centered on the classification value of 1.10. The plain line (vertical) is for the threshold of classification of introns and CDSs at 1.05. The classification function was C = f1 + f3 + f4 below GC = 55% and C = f1 + f3 + f4 + f5 above GC = 55%.
Figure 7.
Figure 7.
Relationship between false positives (In) and false negatives (CDS) at sequence sizes between 200 and 500 bp for the thresholds of classification at 1.05. The introns (In) in this plot are from A. thaliana (□), D. melanogaster (O) and H. sapiens (Δ). The introns indicate the proportion of false positives because they are classified as coding while they are not. The coding sequences (X) are from the six species of Figure 6 grouped together. They indicate the proportion of false negatives because they are classified as non-coding while in fact they are.
Figure 8.
Figure 8.
Distribution of ORF size in introns of A. thaliana (Ath), D. melanogaster (Dm) and H. sapiens (Hs). The largest ORF (bold line) is a reference for the largest ORF that matches the purine bias of a coding sequence (thin line). The distance between the peaks of both distributions measures the gain of introducing the Rrr scoring for coding ORF diagnosis. It also shows the limit of resolution of exon/intron classification with this method.

Similar articles

Cited by

References

    1. Salzberg SL, Delcher AL, Kasif S, et al. Microbial gene identification using interpolated Markov models. Nucleic Acids Res. 1998;26:544–8. - PMC - PubMed
    1. Ikehara K, Omori Y, Arai R, et al. A Novel Theory on the Origin of the Genetic Code: A GNC-SNS Hypothesis. J Mol Evol. 2002;54:530–8. - PubMed
    1. Oba T, Fukushima J, Maruyama M, et al. Catalytic activities of [GADV]-peptides. Origins of Life and Evolution of Biospheres. 2005;34:447–60. - PubMed
    1. Shepherd JCW. Method to determine the reading frame of a protein from the purine/pyrimidine genome sequence and its possible evolutionary justification. Proc Natl Acad Sci U S A. 1981;78:1596–600. - PMC - PubMed
    1. Musto H, Rodriguez-Maseda H, Bernardi G. Compositional properties of nuclear genes from. Plasmodium falciparum Gene. 1995;152:127–32. - PubMed

LinkOut - more resources