

Inferring Transcriptional Interactions by the Optimal Integration of ChIP-chip and Knock-out Data
- PMID: 20140075
- PMCID: PMC2808186
- DOI: 10.4137/bbi.s3445
Inferring Transcriptional Interactions by the Optimal Integration of ChIP-chip and Knock-out Data
Abstract
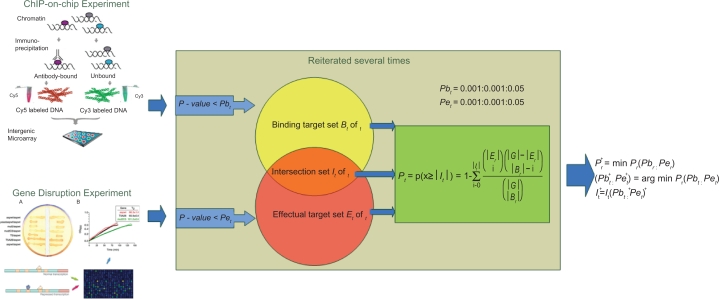
How to combine heterogeneous data sources for reliable prediction of transcriptional regulation is a challenge. Here we present an easy but powerful method to integrate Chromatin immunoprecipitation (ChIP)-chip and knock-out data. Since these two types of data provide complementary (physical and functional) information about transcription, the method combining them is expected to achieve high detection rates and very low false positive rates. We try to seek the optimal integration of these two data using hyper-geometric distribution. We evaluate our method on yeast data and compare our predictions with YEASTRACT, high-quality ChIP-chip data, and literature. The results show that even using low-quality ChIP-chip data, our method uncovers more relations than those inferred before from high-quality data. Furthermore our method achieves a low false positive rate. We find experimental and computational evidence in literature for most transcription factor (TF)-gene relations uncovered by our method.
Keywords: ChIP; P-value threshold; cooperativity; hypergeometric distribution; knock-out data; regulatory interaction; transcription factor.
Figures
Similar articles
-
Global and threshold-free Transcriptional Regulatory Networks reconstruction through integrating ChIP-Chip and expression data.Curr Protein Pept Sci. 2011 Nov;12(7):631-42. doi: 10.2174/1389203711109070631. Curr Protein Pept Sci. 2011. PMID: 21827425
-
Properly defining the targets of a transcription factor significantly improves the computational identification of cooperative transcription factor pairs in yeast.BMC Genomics. 2015;16 Suppl 12(Suppl 12):S10. doi: 10.1186/1471-2164-16-S12-S10. Epub 2015 Dec 9. BMC Genomics. 2015. PMID: 26679776 Free PMC article.
-
Transcription factor regulatory modules provide the molecular mechanisms for functional redundancy observed among transcription factors in yeast.BMC Bioinformatics. 2019 Dec 27;20(Suppl 23):630. doi: 10.1186/s12859-019-3212-8. BMC Bioinformatics. 2019. PMID: 31881824 Free PMC article.
-
Gene regulatory network inference resources: A practical overview.Biochim Biophys Acta Gene Regul Mech. 2020 Jun;1863(6):194430. doi: 10.1016/j.bbagrm.2019.194430. Epub 2019 Oct 31. Biochim Biophys Acta Gene Regul Mech. 2020. PMID: 31678629 Review.
-
Role of ChIP-seq in the discovery of transcription factor binding sites, differential gene regulation mechanism, epigenetic marks and beyond.Cell Cycle. 2014;13(18):2847-52. doi: 10.4161/15384101.2014.949201. Cell Cycle. 2014. PMID: 25486472 Free PMC article. Review.
Cited by
-
Noise regularization removes correlation artifacts in single-cell RNA-seq data preprocessing.Patterns (N Y). 2021 Feb 15;2(3):100211. doi: 10.1016/j.patter.2021.100211. eCollection 2021 Mar 12. Patterns (N Y). 2021. PMID: 33748795 Free PMC article.
-
Single-cell transcriptomics unveils gene regulatory network plasticity.Genome Biol. 2019 Jun 4;20(1):110. doi: 10.1186/s13059-019-1713-4. Genome Biol. 2019. PMID: 31159854 Free PMC article.
References
-
- Friedman N, Linial M, Nachman I, Pe’er D. Using Bayesian networks to analyze expression data. J Comput Biol. 2000;7:3–4. 601–20. - PubMed
-
- Ideker TE, Thorsson V, Karp RM. Discovery of regulatory interactions through perturbation: inference and experimental design. Pac Symp Biocomput. 2000:305–16. - PubMed
-
- Zhu Z, Pilpel Y, Church GM. Computational identification of transcription factor binding sites via a transcription-factor-centric clustering (TFCC) algorithm. J Mol Biol. 2002 Apr 19;318(1):71–81. - PubMed
-
- Imoto S, Goto T, Miyano S. Estimation of genetic networks and functional structures between genes by using Bayesian networks and nonparametric regression. Pac Symp Biocomput. 2002:175–86. - PubMed
LinkOut - more resources
Full Text Sources
Other Literature Sources
Molecular Biology Databases
Miscellaneous
