Association between Painful Physical Symptoms and Clinical Outcomes in Korean Patients with Major Depressive Disorder: A Three-Month Observational Study
- PMID: 20140123
- PMCID: PMC2808794
- DOI: 10.4306/pi.2009.6.4.255
Association between Painful Physical Symptoms and Clinical Outcomes in Korean Patients with Major Depressive Disorder: A Three-Month Observational Study
Abstract
Objective: This paper aims to examine the association between painful physical symptoms (PPS) and major depressive disorder (MDD) in a naturalistic clinical practice setting within a Korean population.
Methods: Patients with acute MDD that joined a multicountry, observational, three-month study in six Asian countries and regions were classified as PPS+ (mean score >/=2) and PPS- (mean score <2) using the modified Somatic Symptom Inventory. In this analysis, we report the results from the Korean subset, where depression severity was assessed using the Clinical Global Impression of Severity (CGI-S) scale and 17-item Hamilton Depression Rating Scale (HAMD(17)). Pain severity was measured using a visual analogue scale (VAS), while the EuroQoL (EQ-5D) assessed patient well-being.
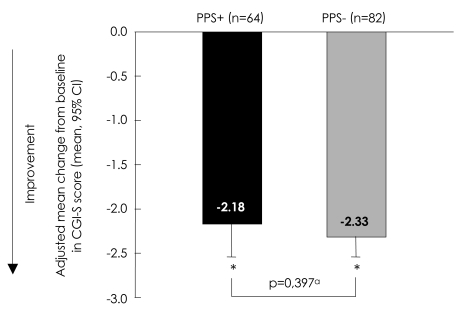
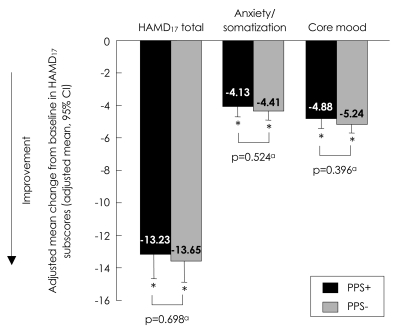
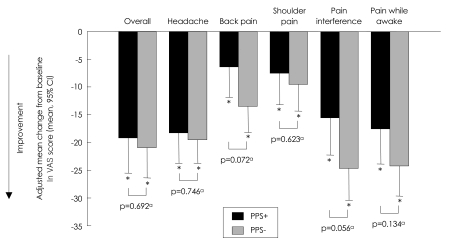
Results: Of 198 patients, 45.96% (91/198) of patients were classified as PPS+, of which 78.02% (71/91) were women. PPS+ patients had significantly more severe depression at baseline {CGI-S score, mean [standard deviation (SD)], PPS+: 5.09 [0.79]; PPS-: 4.63 [0.76]; p<0.001; HAMD(17) total score, mean [SD], PPS+: 24.34 [5.24]; PPS-: 20.76 [5.12]; p<0.001} and poorer quality of life [EQ-5D overall health state, mean (SD), PPS+: 39.37 (20.52); PPS-: 51.27 [20.78]; p<0.001] than PPS- patients. Both groups improved significantly (p<0.001) in depression and pain severity outcomes, as well as quality of life by endpoint, but no significant within-group baseline-to-endpoint change wase observed.
Conclusion: The frequency of PPS was common in Korean patients with MDD, and was associated with more severe depression, poorer quality of life, and a trend towards poorer clinical outcome.
Keywords: Culture; Depression; Depressive disorder; Korea; Major; Pain; Quality of life.
Figures
Similar articles
-
Do concomitant pain symptoms in patients with major depression affect quality of life even when taking into account baseline depression severity?Patient Prefer Adherence. 2013 May 27;7:463-70. doi: 10.2147/PPA.S41703. Print 2013. Patient Prefer Adherence. 2013. PMID: 23818764 Free PMC article.
-
Association between painful physical symptoms and clinical outcomes in Chinese patients with major depressive disorder: a three-month observational study.Chin Med J (Engl). 2010 Aug 5;123(15):2063-9. Chin Med J (Engl). 2010. PMID: 20819543
-
Association between painful physical symptoms and clinical outcomes in East Asian patients with major depressive disorder: a 3-month prospective observational study.Int J Clin Pract. 2009 Jul;63(7):1041-9. doi: 10.1111/j.1742-1241.2009.02107.x. Int J Clin Pract. 2009. PMID: 19570122
-
Frequency and outcomes of painful physical symptoms in a naturalistic population with major depressive disorder: an analysis of pooled observational studies focusing on subjects aged 65 years and over.Int J Clin Pract. 2012 Dec;66(12):1158-67. doi: 10.1111/ijcp.12014. Int J Clin Pract. 2012. PMID: 23163495 Review.
-
The prevalence of painful physical symptoms in major depressive disorder: A systematic review and meta-analysis of observational studies.Prog Neuropsychopharmacol Biol Psychiatry. 2021 Dec 20;111:110372. doi: 10.1016/j.pnpbp.2021.110372. Epub 2021 Jun 5. Prog Neuropsychopharmacol Biol Psychiatry. 2021. PMID: 34098042
Cited by
-
Antidepressant medication treatment patterns in Asian patients with major depressive disorder.Patient Prefer Adherence. 2015 Mar 11;9:421-8. doi: 10.2147/PPA.S68432. eCollection 2015. Patient Prefer Adherence. 2015. PMID: 25792815 Free PMC article.
-
Do concomitant pain symptoms in patients with major depression affect quality of life even when taking into account baseline depression severity?Patient Prefer Adherence. 2013 May 27;7:463-70. doi: 10.2147/PPA.S41703. Print 2013. Patient Prefer Adherence. 2013. PMID: 23818764 Free PMC article.
-
Health state utility values in major depressive disorder treated with pharmacological interventions: a systematic literature review.Health Qual Life Outcomes. 2021 Mar 18;19(1):94. doi: 10.1186/s12955-021-01723-x. Health Qual Life Outcomes. 2021. PMID: 33736649 Free PMC article.
-
Predictors of Changes in Quality of Life of Patients with Major Depressive Disorder-A Prospective Naturalistic 3-Month Follow-Up Study.J Clin Med. 2023 Jul 12;12(14):4628. doi: 10.3390/jcm12144628. J Clin Med. 2023. PMID: 37510745 Free PMC article.
References
-
- Greden JF. Physical symptoms of depression: unmet needs. J Clin Psychiatry. 2003;64:5–11. - PubMed
-
- Ohayon MM, Hong SC. Prevalence of major depressive disorder in the general population of South Korea. J Psychiatr Res. 2006;40:30–36. - PubMed
-
- Cho MJ, Kim JK, Jeon HJ, Suh T, Chung IW, Hong JP, et al. Lifetime and 12-month prevalence of DSM-IV psychiatric disorders among Korean adults. J Nerv Ment Dis. 2007;195:203–210. - PubMed
-
- Kessler RC, Berglund P, Demler O, Jin R, Koretz D, Merikangas KR, et al. National Comorbidity Survey Replication. The epidemiology of major depressive disorder: results from the National Comorbidity Survey Replication (NCS-R) JAMA. 2003;289:3095–3105. - PubMed
-
- Weissman MM, Bland RC, Canino GJ, Faravelli C, Greenwald S, Hwu HG, et al. Cross-national epidemiology of major depression and bipolar disorder. JAMA. 1996;276:293–299. - PubMed
LinkOut - more resources
Full Text Sources