Genomic approaches uncover increasing complexities in the regulatory landscape at the human SCL (TAL1) locus
- PMID: 20140202
- PMCID: PMC2816701
- DOI: 10.1371/journal.pone.0009059
Genomic approaches uncover increasing complexities in the regulatory landscape at the human SCL (TAL1) locus
Abstract
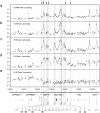
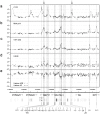
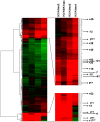
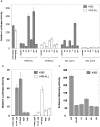
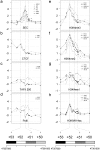
The SCL (TAL1) transcription factor is a critical regulator of haematopoiesis and its expression is tightly controlled by multiple cis-acting regulatory elements. To elaborate further the DNA elements which control its regulation, we used genomic tiling microarrays covering 256 kb of the human SCL locus to perform a concerted analysis of chromatin structure and binding of regulatory proteins in human haematopoietic cell lines. This approach allowed us to characterise further or redefine known human SCL regulatory elements and led to the identification of six novel elements with putative regulatory function both up and downstream of the SCL gene. They bind a number of haematopoietic transcription factors (GATA1, E2A LMO2, SCL, LDB1), CTCF or components of the transcriptional machinery and are associated with relevant histone modifications, accessible chromatin and low nucleosomal density. Functional characterisation shows that these novel elements are able to enhance or repress SCL promoter activity, have endogenous promoter function or enhancer-blocking insulator function. Our analysis opens up several areas for further investigation and adds new layers of complexity to our understanding of the regulation of SCL expression.
Conflict of interest statement
Figures
Similar articles
-
Aberrant TAL1 activation is mediated by an interchromosomal interaction in human T-cell acute lymphoblastic leukemia.Leukemia. 2014 Feb;28(2):349-61. doi: 10.1038/leu.2013.158. Epub 2013 May 23. Leukemia. 2014. PMID: 23698277 Free PMC article.
-
Tal1/SCL binding to pericentromeric DNA represses transcription.J Biol Chem. 2005 Apr 1;280(13):12956-66. doi: 10.1074/jbc.M412721200. Epub 2005 Jan 27. J Biol Chem. 2005. PMID: 15677454
-
Mapping and functional characterisation of a CTCF-dependent insulator element at the 3' border of the murine Scl transcriptional domain.PLoS One. 2012;7(3):e31484. doi: 10.1371/journal.pone.0031484. Epub 2012 Mar 1. PLoS One. 2012. PMID: 22396734 Free PMC article.
-
The Hematopoietic Stem and Progenitor Cell Cistrome: GATA Factor-Dependent cis-Regulatory Mechanisms.Curr Top Dev Biol. 2016;118:45-76. doi: 10.1016/bs.ctdb.2016.01.002. Epub 2016 Feb 26. Curr Top Dev Biol. 2016. PMID: 27137654 Free PMC article. Review.
-
Ldb1 complexes: the new master regulators of erythroid gene transcription.Trends Genet. 2014 Jan;30(1):1-9. doi: 10.1016/j.tig.2013.10.001. Epub 2013 Nov 27. Trends Genet. 2014. PMID: 24290192 Free PMC article. Review.
Cited by
-
Identification of biologically relevant enhancers in human erythroid cells.J Biol Chem. 2013 Mar 22;288(12):8433-8444. doi: 10.1074/jbc.M112.413260. Epub 2013 Jan 22. J Biol Chem. 2013. PMID: 23341446 Free PMC article.
-
Complex exon-intron marking by histone modifications is not determined solely by nucleosome distribution.PLoS One. 2010 Aug 23;5(8):e12339. doi: 10.1371/journal.pone.0012339. PLoS One. 2010. PMID: 20808788 Free PMC article.
-
Conceptual framework of the eco-physiological phases of insect diapause development justified by transcriptomic profiling.Proc Natl Acad Sci U S A. 2017 Aug 8;114(32):8532-8537. doi: 10.1073/pnas.1707281114. Epub 2017 Jul 18. Proc Natl Acad Sci U S A. 2017. PMID: 28720705 Free PMC article.
-
Genomic Alterations of Non-Coding Regions Underlie Human Cancer: Lessons from T-ALL.Trends Mol Med. 2016 Dec;22(12):1035-1046. doi: 10.1016/j.molmed.2016.10.004. Epub 2016 Oct 27. Trends Mol Med. 2016. PMID: 28240214 Free PMC article. Review.
-
Stem Cell Leukemia: how a TALented actor can go awry on the hematopoietic stage.Leukemia. 2016 Oct;30(10):1968-1978. doi: 10.1038/leu.2016.169. Epub 2016 Jun 13. Leukemia. 2016. PMID: 27443261 Review.
References
-
- Robertson SM, Kennedy M, Shannon JM, Keller G. A transitional stage in the commitment of mesoderm to hematopoiesis requiring the transcription factor SCL/tal-1. Development. 2000;127:2447–2459. - PubMed
-
- Shivdasani RA, Mayer EL, Orkin SH. Absence of blood formation in mice lacking the T-cell leukaemia oncoprotein tal-1/SCL. Nature. 1995;373:432–434. - PubMed
-
- Porcher C, Swat W, Rockwell K, Fujiwara Y, Alt FW, et al. The T cell leukemia oncoprotein SCL/tal-1 is essential for development of all hematopoietic lineages. Cell. 1996;86:47–57. - PubMed
Publication types
MeSH terms
Substances
Grants and funding
LinkOut - more resources
Full Text Sources
Other Literature Sources
Research Materials
Miscellaneous

