

Regulation of gene expression in hepatic cells by the mammalian Target of Rapamycin (mTOR)
- PMID: 20140209
- PMCID: PMC2816708
- DOI: 10.1371/journal.pone.0009084
Regulation of gene expression in hepatic cells by the mammalian Target of Rapamycin (mTOR)
Abstract
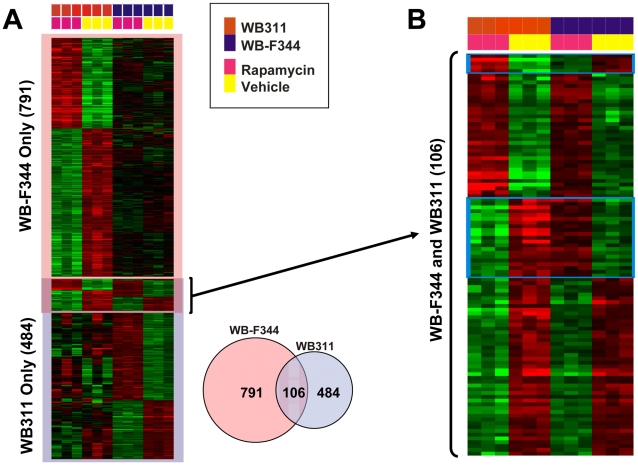
Background: We investigated mTOR regulation of gene expression by studying rapamycin effect in two hepatic cell lines, the non-tumorigenic WB-F344 cells and the tumorigenic WB311 cells. The latter are resistant to the growth inhibitory effects of rapamycin, thus providing us with an opportunity to study the gene expression effects of rapamycin without confounding effects on cell proliferation.
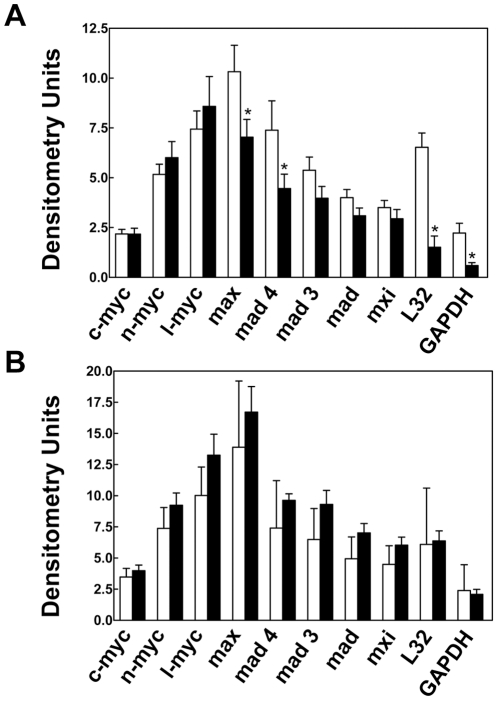
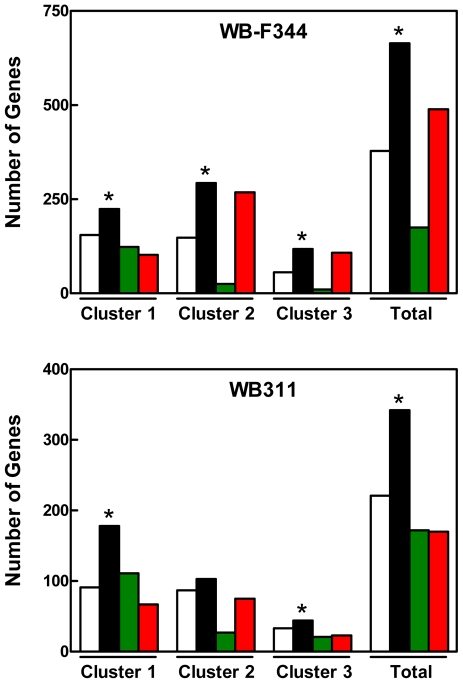
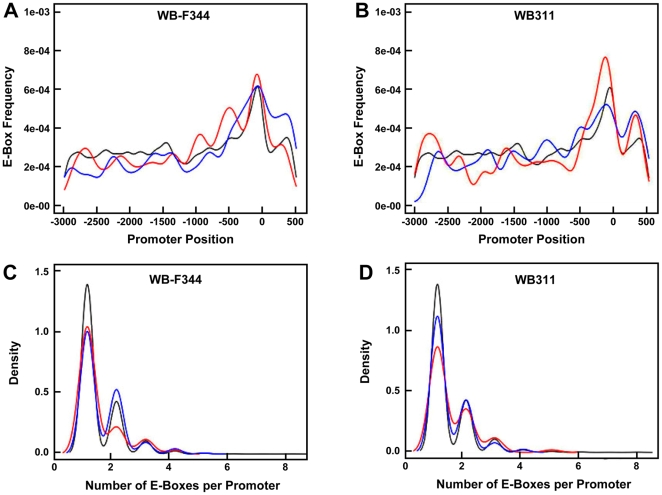
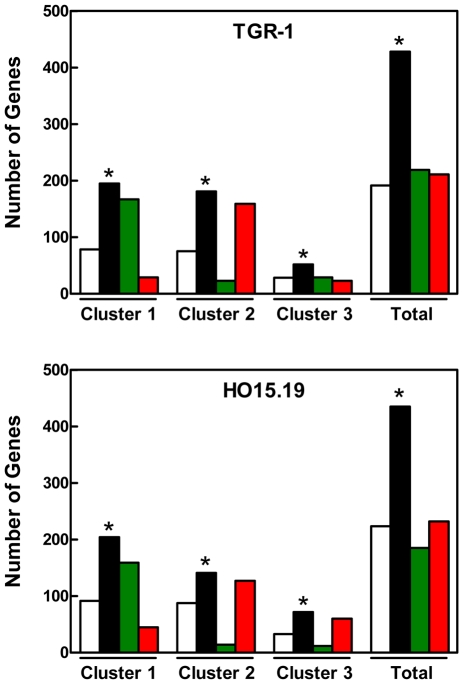
Methodology/principal findings: The hepatic cells were exposed to rapamycin for 24 hr. Microarray analysis on total RNA preparations identified genes that were affected by rapamycin in both cell lines and, therefore, modulated independent of growth arrest. Further studies showed that the promoter regions of these genes included E-box-containing transcription factor binding sites at higher than expected rates. Based on this, we tested the hypothesis that c-Myc is involved in regulation of gene expression by mTOR by comparing genes altered by rapamycin in the hepatic cells and by c-Myc induction in fibroblasts engineered to express c-myc in an inducible manner. Results showed enrichment for c-Myc targets among rapamycin sensitive genes in both hepatic cell lines. However, microarray analyses on wild type and c-myc null fibroblasts showed similar rapamycin effect, with the set of rapamycin-sensitive genes being enriched for c-Myc targets in both cases.
Conclusions/significance: There is considerable overlap in the regulation of gene expression by mTOR and c-Myc. However, regulation of gene expression through mTOR is c-Myc-independent and cannot be attributed to the involvement of specific transcription factors regulated by the rapamycin-sensitive mTOR Complex 1.
Conflict of interest statement
Figures
Similar articles
-
AKT activity determines sensitivity to mammalian target of rapamycin (mTOR) inhibitors by regulating cyclin D1 and c-myc expression.J Biol Chem. 2004 Jan 23;279(4):2737-46. doi: 10.1074/jbc.M309999200. Epub 2003 Oct 23. J Biol Chem. 2004. PMID: 14576155
-
Rapamycin response in tumorigenic and non-tumorigenic hepatic cell lines.PLoS One. 2009 Oct 9;4(10):e7373. doi: 10.1371/journal.pone.0007373. PLoS One. 2009. PMID: 19816606 Free PMC article.
-
MNK kinases facilitate c-myc IRES activity in rapamycin-treated multiple myeloma cells.Oncogene. 2013 Jan 10;32(2):190-7. doi: 10.1038/onc.2012.43. Epub 2012 Feb 27. Oncogene. 2013. PMID: 22370634 Free PMC article.
-
Targeting mTOR globally in cancer: thinking beyond rapamycin.Cell Cycle. 2009 Dec;8(23):3831-7. doi: 10.4161/cc.8.23.10070. Epub 2009 Dec 14. Cell Cycle. 2009. PMID: 19901542 Review.
-
Dissecting the role of mTOR: lessons from mTOR inhibitors.Biochim Biophys Acta. 2010 Mar;1804(3):433-9. doi: 10.1016/j.bbapap.2009.12.001. Epub 2009 Dec 11. Biochim Biophys Acta. 2010. PMID: 20005306 Review.
Cited by
-
Still Living Better through Chemistry: An Update on Caloric Restriction and Caloric Restriction Mimetics as Tools to Promote Health and Lifespan.Int J Mol Sci. 2020 Dec 3;21(23):9220. doi: 10.3390/ijms21239220. Int J Mol Sci. 2020. PMID: 33287232 Free PMC article. Review.
-
Adaptation of HepG2 cells to a steady-state reduction in the content of protein phosphatase 6 (PP6) catalytic subunit.Exp Cell Res. 2015 Jul 15;335(2):224-37. doi: 10.1016/j.yexcr.2015.05.008. Epub 2015 May 18. Exp Cell Res. 2015. PMID: 25999147 Free PMC article.
-
TOR Facilitates the Targeting of the 19S Proteasome Subcomplex To Enhance Transcription Complex Assembly at the Promoters of the Ribosomal Protein Genes.Mol Cell Biol. 2018 Jun 28;38(14):e00469-17. doi: 10.1128/MCB.00469-17. Print 2018 Jul 15. Mol Cell Biol. 2018. PMID: 29712756 Free PMC article.
-
The Molecular Classification of Pheochromocytomas and Paragangliomas: Discovering the Genomic and Immune Landscape of Metastatic Disease.Endocr Pathol. 2024 Dec;35(4):279-292. doi: 10.1007/s12022-024-09830-3. Epub 2024 Oct 28. Endocr Pathol. 2024. PMID: 39466488 Free PMC article. Review.
-
Transcriptional regulation of gene expression during osmotic stress responses by the mammalian target of rapamycin.Nucleic Acids Res. 2012 May;40(10):4368-84. doi: 10.1093/nar/gks038. Epub 2012 Jan 28. Nucleic Acids Res. 2012. PMID: 22287635 Free PMC article.
References
-
- Hall MN. mTOR-what does it do? Transplant Proc. 2008;40:S5–S8. - PubMed
-
- Polak P, Hall MN. mTOR and the control of whole body metabolism. Curr Opin Cell Biol. 2009;21:209–218. - PubMed
-
- Sabatini DM. mTOR and cancer: insights into a complex relationship. Nat Rev Cancer. 2006;6:729–734. - PubMed
-
- Guertin DA, Sabatini DM. Defining the role of mTOR in cancer. Cancer Cell. 2007;12:9–22. - PubMed
Publication types
MeSH terms
Substances
Associated data
- Actions
- Actions
Grants and funding
LinkOut - more resources
Full Text Sources
Molecular Biology Databases
Research Materials
Miscellaneous
