. 2010 Feb 5;5(2):e9085.
doi: 10.1371/journal.pone.0009085.

Gut microbiota in human adults with type 2 diabetes differs from non-diabetic adults

Affiliations

Gut microbiota in human adults with type 2 diabetes differs from non-diabetic adults

Nadja Larsen et al. PLoS One. .

Abstract

Background: Recent evidence suggests that there is a link between metabolic diseases and bacterial populations in the gut. The aim of this study was to assess the differences between the composition of the intestinal microbiota in humans with type 2 diabetes and non-diabetic persons as control.

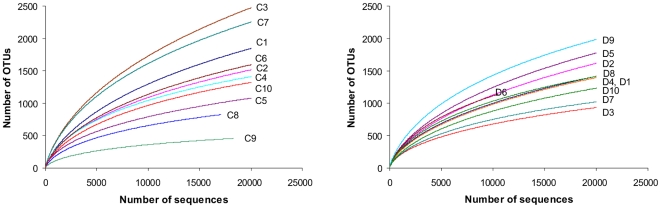
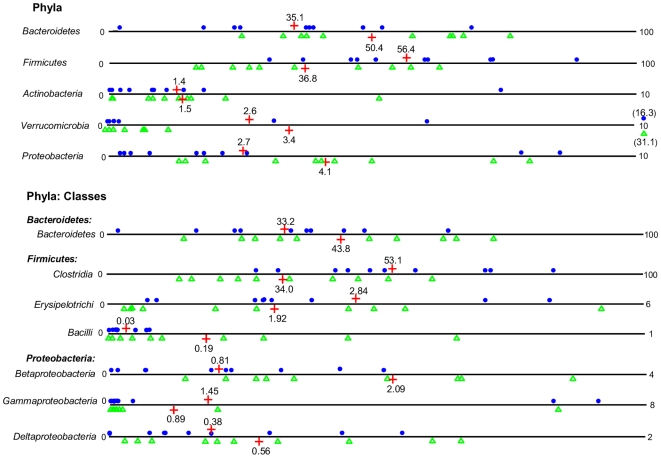
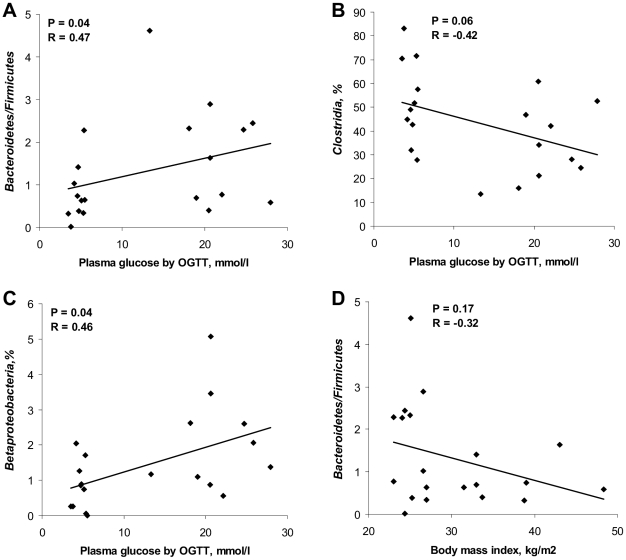
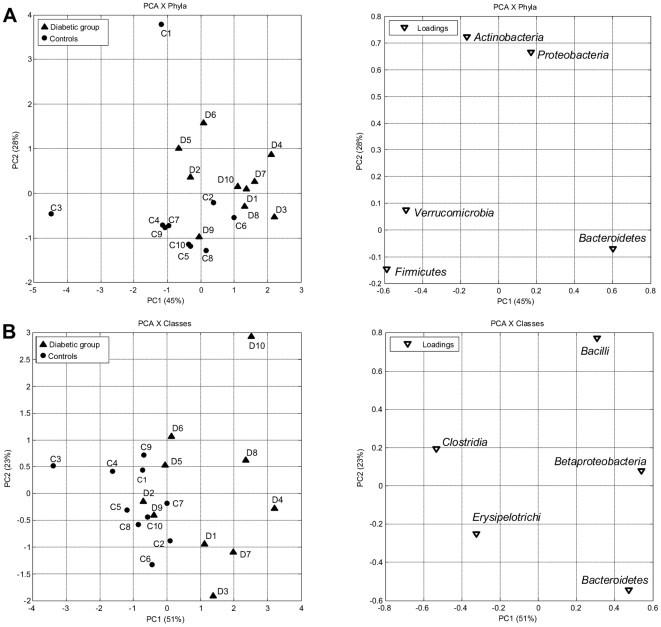
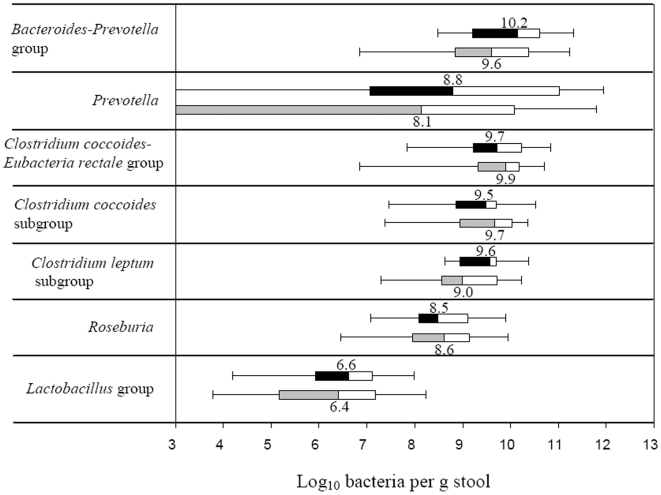
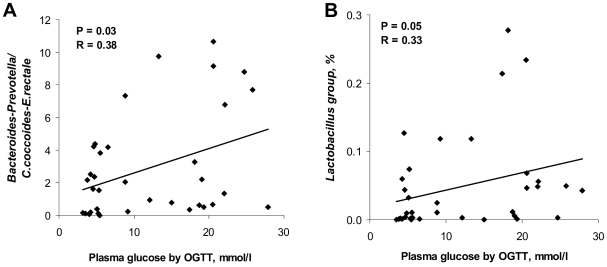
Methods and findings: The study included 36 male adults with a broad range of age and body-mass indices (BMIs), among which 18 subjects were diagnosed with diabetes type 2. The fecal bacterial composition was investigated by real-time quantitative PCR (qPCR) and in a subgroup of subjects (N = 20) by tag-encoded amplicon pyrosequencing of the V4 region of the 16S rRNA gene. The proportions of phylum Firmicutes and class Clostridia were significantly reduced in the diabetic group compared to the control group (P = 0.03). Furthermore, the ratios of Bacteroidetes to Firmicutes as well as the ratios of Bacteroides-Prevotella group to C. coccoides-E. rectale group correlated positively and significantly with plasma glucose concentration (P = 0.04) but not with BMIs. Similarly, class Betaproteobacteria was highly enriched in diabetic compared to non-diabetic persons (P = 0.02) and positively correlated with plasma glucose (P = 0.04).

Conclusions: The results of this study indicate that type 2 diabetes in humans is associated with compositional changes in intestinal microbiota. The level of glucose tolerance should be considered when linking microbiota with metabolic diseases such as obesity and developing strategies to control metabolic diseases by modifying the gut microbiota.


Conflict of interest statement

Competing Interests: The authors have declared that no competing interests exist.

Figures

Figure 1
Figure 1. Rarefaction curves.
Rarefaction analysis of V4 pyrosequencing tags of the 16S rRNA gene in fecal microbiota from adults with diabetes type 2 (D1–D10) and non-diabetic controls (C1–C10). Sample codes are the same as in Table 1. Rarefaction curves were constructed at 3% distance using RDP release 10 (Pyrosequencing pipelines).
Figure 2
Figure 2. Relative abundances of bacterial phyla and classes.
Relative abundances (%) of bacteria were determined in feces from human adults with type 2 diabetes (green triangles, N = 10) and non-diabetic controls (blue dots, N = 10) by pyrosequencing analysis of the V4 region of the 16S rRNA gene. Mean values are denoted by red crosses and numbers. Values out of scale are shown in brackets.
Figure 3
Figure 3. Correlation between OGTT or BMI and bacterial estimates by pyrosequencing.
Correlation between OGTT plasma glucose and (A) ratios of Bacteroidetes to Firmicutes, (B) relative abundance of Clostridia, (C) relative abundance of Betaproteobacteria. (D) Correlation between body mass indices and ratios of Bacteroidetes to Firmicutes. The Spearman Rank probability (P) and correlation (R) are shown in the graphs. Bacterial abundances were determined by pyrosequencing of the V4 region of the 16S rRNA gene in fecal bacterial DNA from human adults with type 2 diabetes (N = 10) and non-diabetic controls (N = 10).
Figure 4
Figure 4. PCA plots of bacterial phyla and classes.
PCA plots showing the grouping of human adults with type 2 diabetes (▴, D1–D10) and non-diabetic controls (•, C1–C10) according to the abundances of bacterial phyla (A) and classes (B) in the fecal bacterial DNA as determined by pyrosequencing of the V4 region of the 16S rRNA gene.
Figure 5
Figure 5. Box-and-whisker plots of bacterial groups quantified by qPCR.
Bacterial groups quantified by SYBR Green qPCR and expressed as Log10 bacteria per g stool in human adults with type 2 diabetes (black and white boxes; N = 18) and non-diabetic controls (grey and white boxes; N = 18). The median counts are presented by numbers. Boxes show the upper (75%) and the lower (25%) percentiles of the data. Whiskers indicate the highest and the smallest values.
Figure 6
Figure 6. Correlation between OGTT and bacterial estimates by qPCR.
Correlation between OGTT plasma glucose and (A) ratios of the Bacteroides-Prevotella group to C.coccoides-E.rectale group, (B) relative abundance of the Lactobacillus group determined by SYBR Green qPCR assay in feces from human adults with type 2 diabetes (N = 18) and non-diabetic controls (N = 18). The Spearman Rank probability (P) and correlation (R) are shown in the graphs.

References

    1. Cani PD, Possemiers S, Van de Wiele T, Guiot Y, Everard A, et al. Changes in gut microbiota control inflammation in obese mice through a mechanism involving GLP-2-driven improvement of gut permeability. Gut. 2009;58:1091–1103. - PMC - PubMed
    1. Wellen KE, Hotamisligil GS. Inflammation, stress, and diabetes. J Clin Invest. 2005;115:1111–1119. - PMC - PubMed
    1. Tilg H, Moschen AR, Kaser A. Obesity and the microbiota. Gastroenterology. 2009;136:1476–1483. - PubMed
    1. Tsukumo DM, Carvalho BM, Carvalho MA, Saad MJA. Translational research into gut microbiota: new horizons in obesity treatment. Arquivos Brasileiros de Endocrinologia e Metabologia. 2009;53:139–144. - PubMed
    1. Dandona P, Aljada A, Bandyopadhyay A. Inflammation: the link between insulin resistance, obesity and diabetes. Trends Immunol. 2004;25:4–7. - PubMed

Publication types