Lack of nAChR activity depresses cochlear maturation and up-regulates GABA system components: temporal profiling of gene expression in alpha9 null mice
- PMID: 20140217
- PMCID: PMC2816210
- DOI: 10.1371/journal.pone.0009058
Lack of nAChR activity depresses cochlear maturation and up-regulates GABA system components: temporal profiling of gene expression in alpha9 null mice
Abstract
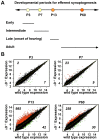
Background: It has previously been shown that deletion of chrna9, the gene encoding the alpha9 nicotinic acetylcholine receptor (nAChR) subunit, results in abnormal synaptic terminal structure. Additionally, all nAChR-mediated cochlear activity is lost, as characterized by a failure of the descending efferent system to suppress cochlear responses to sound. In an effort to characterize the molecular mechanisms underlying the structural and functional consequences following loss of alpha9 subunit expression, we performed whole-transcriptome gene expression analyses on cochleae of wild type and alpha9 knockout (alpha9(-/-)) mice during postnatal days spanning critical periods of synapse formation and maturation.
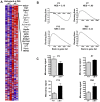
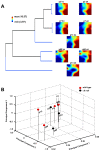
Principal findings: Data revealed that loss of alpha9 receptor subunit expression leads to an up-regulation of genes involved in synaptic transmission and ion channel activity. Unexpectedly, loss of alpha9 receptor subunit expression also resulted in an increased expression of genes encoding GABA receptor subunits and the GABA synthetic enzyme, glutamic acid decarboxylase. These data suggest the existence of a previously unrecognized association between the nicotinic cholinergic and GABAergic systems in the cochlea. Computational analyses have highlighted differential expression of several gene sets upon loss of nicotinic cholinergic activity in the cochlea. Time-series analysis of whole transcriptome patterns, represented as self-organizing maps, revealed a disparate pattern of gene expression between alpha9(-/-) and wild type cochleae at the onset of hearing (P13), with knockout samples resembling immature postnatal ages.
Conclusions: We have taken a systems biology approach to provide insight into molecular programs influenced by the loss of nicotinic receptor-based cholinergic activity in the cochlea and to identify candidate genes that may be involved in nicotinic cholinergic synapse formation, stabilization or function within the inner ear. Additionally, our data indicate a change in the GABAergic system upon loss of alpha9 nicotinic receptor subunit within the cochlea.
Conflict of interest statement
Figures


Similar articles
-
Activity of nAChRs containing alpha9 subunits modulates synapse stabilization via bidirectional signaling programs.Dev Neurobiol. 2009 Dec;69(14):931-49. doi: 10.1002/dneu.20753. Dev Neurobiol. 2009. PMID: 19790106 Free PMC article.
-
Acetylcholine receptors in the retinas of the α7 nicotinic acetylcholine receptor knockout mouse.Mol Vis. 2014 Sep 20;20:1328-56. eCollection 2014. Mol Vis. 2014. PMID: 25352741 Free PMC article.
-
Assessment of the expression and role of the α1-nAChR subunit in efferent cholinergic function during the development of the mammalian cochlea.J Neurophysiol. 2016 Aug 1;116(2):479-92. doi: 10.1152/jn.01038.2015. Epub 2016 Apr 20. J Neurophysiol. 2016. PMID: 27098031 Free PMC article.
-
Nicotinic acetylcholine receptor structure and function in the efferent auditory system.Anat Rec A Discov Mol Cell Evol Biol. 2006 Apr;288(4):424-34. doi: 10.1002/ar.a.20302. Anat Rec A Discov Mol Cell Evol Biol. 2006. PMID: 16550589 Review.
-
The α9α10 acetylcholine receptor: A non-neuronal nicotinic receptor.Pharmacol Res. 2023 Apr;190:106735. doi: 10.1016/j.phrs.2023.106735. Epub 2023 Mar 15. Pharmacol Res. 2023. PMID: 36931539 Review.
Cited by
-
The mammalian olivocochlear system--a legacy of non-cerebellar research in the Mugnaini lab.Cerebellum. 2015 Oct;14(5):557-69. doi: 10.1007/s12311-014-0637-5. Cerebellum. 2015. PMID: 25592068 Free PMC article. Review.
-
Modulation of hair cell efferents.Hear Res. 2011 Sep;279(1-2):1-12. doi: 10.1016/j.heares.2010.12.018. Epub 2010 Dec 25. Hear Res. 2011. PMID: 21187136 Free PMC article. Review.
-
The mammalian efferent vestibular system plays a crucial role in the high-frequency response and short-term adaptation of the vestibuloocular reflex.J Neurophysiol. 2015 Dec;114(6):3154-65. doi: 10.1152/jn.00307.2015. Epub 2015 Sep 30. J Neurophysiol. 2015. PMID: 26424577 Free PMC article.
-
Perinatal nicotine exposure impairs the maturation of glutamatergic inputs in the auditory brainstem.J Physiol. 2017 Jun 1;595(11):3573-3590. doi: 10.1113/JP274059. Epub 2017 Mar 10. J Physiol. 2017. PMID: 28190266 Free PMC article.
-
Transcriptomic analysis of cell-free fetal RNA suggests a specific molecular phenotype in trisomy 18.Hum Genet. 2011 Mar;129(3):295-305. doi: 10.1007/s00439-010-0923-3. Epub 2010 Dec 9. Hum Genet. 2011. PMID: 21152935 Free PMC article.
References
-
- Guinan JJ, Jr, Warr WB, Norris BE. Differential olivocochlear projections from lateral versus medial zones of the superior olivary complex. J Comp Neurol. 1983;221:358–370. - PubMed
-
- Guinan JJ, Jr, Warr WB, Norris BE. Topographic organization of the olivocochlear projections from the lateral and medial zones of the superior olivary complex. J Comp Neurol. 1984;226:21–27. - PubMed
-
- Warr WB, Guinan JJ., Jr Efferent innervation of the organ of corti: two separate systems. Brain Res. 1979;173:152–155. - PubMed
-
- Elgoyhen AB, Johnson DS, Boulter J, Vetter DE, Heinemann S. Alpha 9: an acetylcholine receptor with novel pharmacological properties expressed in rat cochlear hair cells. Cell. 1994;79:705–715. - PubMed
Publication types
MeSH terms
Substances
Associated data
- Actions
Grants and funding
LinkOut - more resources
Full Text Sources
Molecular Biology Databases

